Presentation Materials for Investors August 2020 Exhibit 99.1
2 Disclaimer • This presentation includes certain “forward - looking statements” within the meaning of The U.S. Private Securities Litigation Reform Act of 1995. • These statements are based on current expectations and currently available information. • Actual results may differ materially from these expectations due to certain risks, uncertainties and other important factors, including the risk factors set forth in the most recent annual and periodic reports of Toyota Motor Corporation and Toyota Motor Credit Corporation. • We do not undertake to update the forward - looking statements to reflect actual results or changes in the factors affecting the forward - looking statements. • This presentation does not constitute an offer to sell or a solicitation of an offer to purchase any securities. Any offer or sale of securities will be made only by means of a prospectus and related documentation. • Investors and others should note that we announce material financial information using the investor relations section of our corporate website ( http://www.toyotafinancial.com ) and SEC filings. We use these channels, press releases, as well as social media to communicate with our investors, customers and the general public about our company, our services and other issues. While not all of the information that we post on social media is of a material nature, some information could be material. Therefore, we encourage investors, the media, and others interested in our company to review the information we post on the Toyota Motor Credit Corporation Twitter Feed ( http://www.twitter.com/toyotafinancial ). We may update our social media channels from time to time on the investor relations section of our corporate website.
3 Disclaimer • This presentation includes certain “forward - looking statements” within the meaning of The U.S. Private Securities Litigation Ref orm Act of 1995. • These statements are based on current expectations and currently available information. • Actual results may differ materially from these expectations due to certain risks, uncertainties and other important factors, in cluding the risk factors set forth in the most recent annual and periodic reports of Toyota Motor Corporation and Toyota Motor Credit Cor por ation (“TMCC”). • We do not undertake to update the forward - looking statements to reflect actual results or changes in the factors affecting the f orward - looking statements. • This presentation does not constitute or form part of and should not be construed as, an offer to sell or issue or the solici tat ion of an offer to purchase or subscribe for securities of TMCC in any jurisdiction or an inducement to enter into investment activity in any ju risdiction. Neither this presentation nor any part thereof, nor the fact of its distribution, shall form the basis of, or be relied on in co nnection with, any contract or commitment or investment decision whatsoever. Any offer or sale of securities by TMCC will be made only by m ean s of a prospectus and related documentation. • Investors and prospective investors in securities of TMCC are required to make their own independent investigation and apprai sal of the business and financial condition of TMCC and the nature of its securities. This presentation does not constitute a recommenda tio n regarding securities of TMCC. Any prospective purchaser of securities in TMCC is recommended to seek its own independent fina nci al advice. • This presentation and its contents are directed only at and may only be communicated to (a) persons in member states of the European Economic Area who are “qualified investors” within the meaning of Article 2(e) of the Prospectus Regulation (EU) 201 7/1 129, and (b) in the United Kingdom to such “qualified investors” who are ( i ) persons who have professional experience in matters relating to investments falling within Article 19(5) of the Financial Services and Markets Act 2000 (Financial Promotion) Order 2005 (the “O rder”), or (ii) high net worth entities and other persons to whom it may lawfully be communicated, falling within Article 49(2)(a) to (d ) o f the Order, or (iii) other persons to whom it may otherwise lawfully be communicated (all such persons in (a) through (b) are collectivel y r eferred to as “Relevant Persons”). This presentation must not be acted or relied on by persons who are not Relevant Persons. Any investm ent or investment activity to which this presentation relates is available only to Relevant Persons and will be engaged in only with Re levant Persons. • This presentation is an advertisement and not a prospectus and investors should not subscribe for or purchase any securities of TMCC referred to in this presentation or otherwise except on the basis of information in the Euro Medium Term Note Programme base prospectus of Toyota Motor Finance (Netherlands) B.V., Toyota Credit Canada Inc., Toyota Finance Australia Limited and Toyota Mo tor Credit Corporation dated 13 September 2019 as supplemented from time to time (together, the “Prospectus”) together with the applicable final terms which are or will be, as applicable, available on the website of the London Stock Exchange plc at www.londonstockexchange.com/exchange/news/market - news/marketnewshome.html. Investors should read the Prospectus before making an investment decision in order to fully understand the potential risks and rewards associated with the decision to in ves t in any securities of Toyota Motor Credit Corporation issued under the Euro Medium Term Note Programme . Approval of the Prospectus by the Central Bank of Ireland should not be understood as an endorsement of securities issued under the Euro Medium Term Note Programme . • Investors and others should note that we announce material financial information using the investor relations section of our cor porate website ( http://www.toyotafinancial.com ) and SEC filings. We use these channels, press releases, as well as social media to communicate with our investors, customers and the general public about our company, our services and other issues. While not all of the information that we post on social media is of a material nature, some information could be material. Therefore, we encou rag e investors, the media, and others interested in our company to review the information we post on the Toyota Motor Credit Corpo rat ion Twitter Feed ( http://www.twitter.com/toyotafinancial ). We may update our social media channels from time to time on the investor relations section of our corporate website.
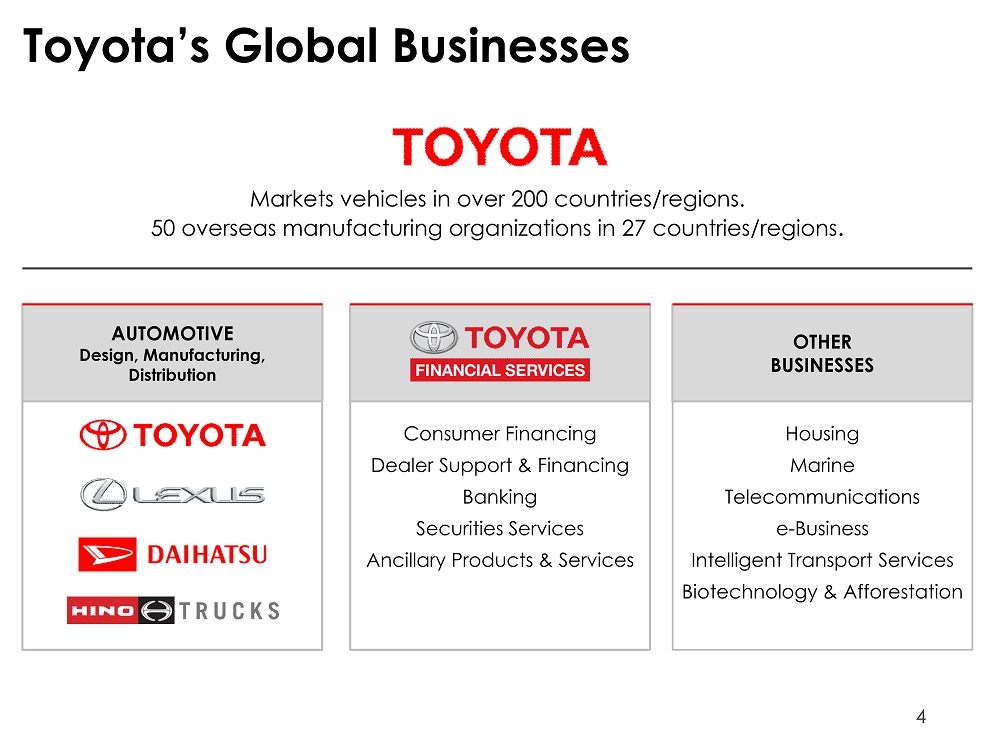
4 Toyota’s Global Businesses Markets vehicles in over 200 countries/regions. 50 overseas manufacturing organizations in 27 countries/regions . AUTOMOTIVE Design, Manufacturing, Distribution Consumer Financing Dealer Support & Financing Banking Securities Services Ancillary Products & Services OTHER BUSINESSES Housing Marine Telecommunications e - Business Intelligent Transport Services Biotechnology & Afforestation
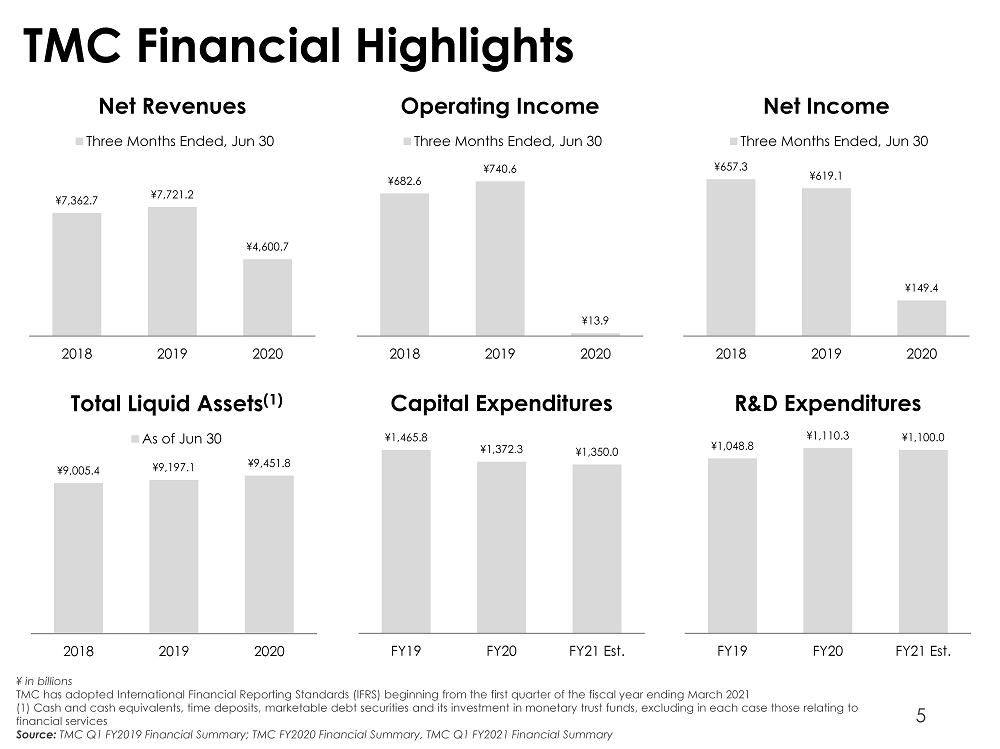
5 TMC Financial Highlights ¥ in billions TMC has adopted International Financial Reporting Standards (IFRS) beginning from the first quarter of the fiscal year ending Ma rch 2021 (1) Cash and cash equivalents, time deposits, marketable debt securities and its investment in monetary trust funds, excludin g i n each case those relating to financial services Source: TMC Q1 FY2019 Financial Summary; TMC FY2020 Financial Summary, TMC Q1 FY2021 Financial Summary ¥7,362.7 ¥7,721.2 ¥4,600.7 2018 2019 2020 Net Revenues Three Months Ended, Jun 30 ¥682.6 ¥740.6 ¥13.9 2018 2019 2020 Operating Income Three Months Ended, Jun 30 ¥657.3 ¥619.1 ¥149.4 2018 2019 2020 Net Income Three Months Ended, Jun 30 ¥9,005.4 ¥9,197.1 ¥9,451.8 2018 2019 2020 Total Liquid Assets (1) As of Jun 30 ¥1,465.8 ¥1,372.3 ¥1,350.0 FY19 FY20 FY21 Est. Capital Expenditures ¥1,048.8 ¥1,110.3 ¥1,100.0 FY19 FY20 FY21 Est. R&D Expenditures
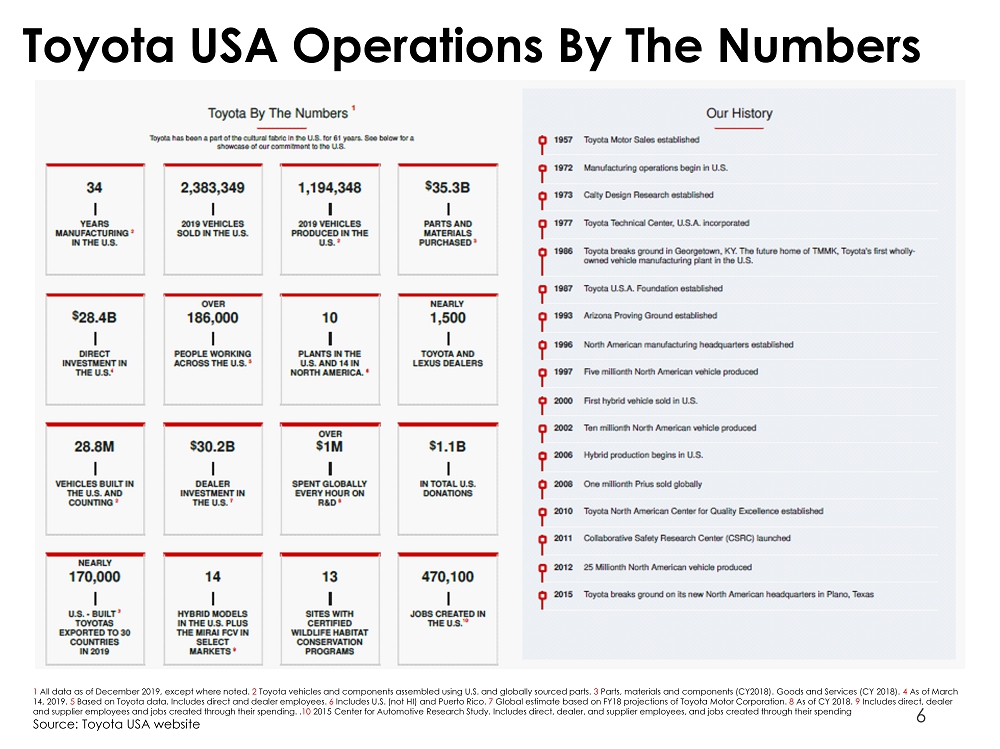
6 Toyota USA Operations By The Numbers 1 All data as of December 2019, except where noted. 2 Toyota vehicles and components assembled using U.S. and globally sourced parts. 3 Parts, materials and components (CY2018). Goods and Services (CY 2018). 4 As of March 14, 2019. 5 Based on Toyota data. Includes direct and dealer employees. 6 Includes U.S. (not HI) and Puerto Rico. 7 Global estimate based on FY18 projections of Toyota Motor Corporation. 8 As of CY 2018. 9 Includes direct, dealer and supplier employees and jobs created through their spending. . 10 2015 Center for Automotive Research Study. Includes direct, dealer, and supplier employees, and jobs created through their sp en ding Source: Toyota USA website
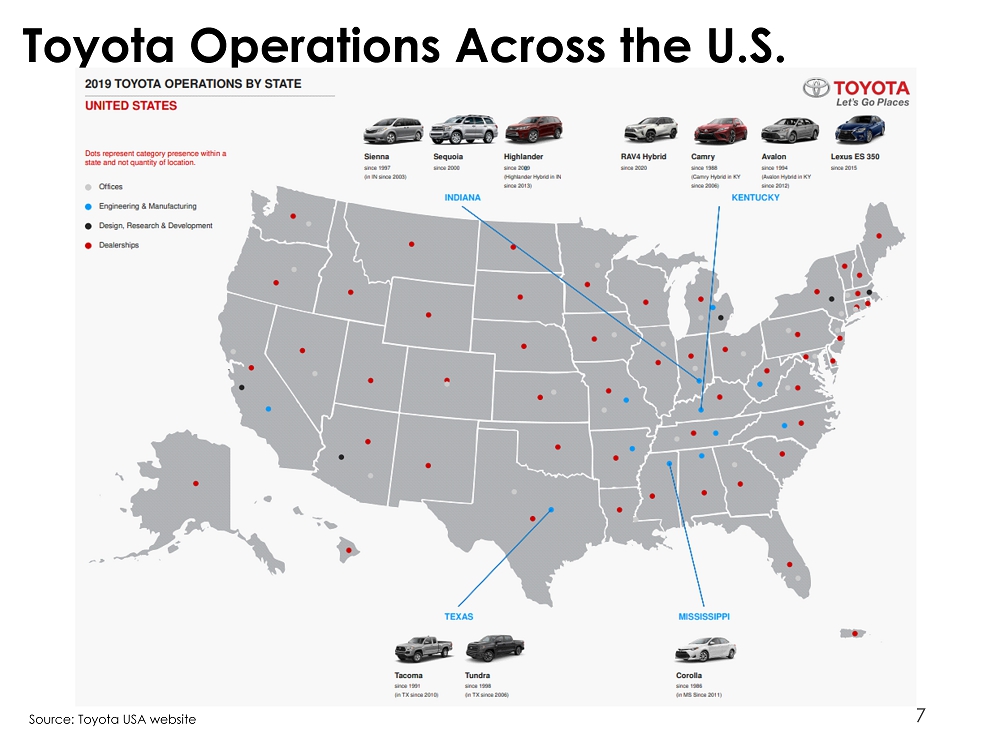
7 Toyota Operations Across the U.S. Source: Toyota USA website
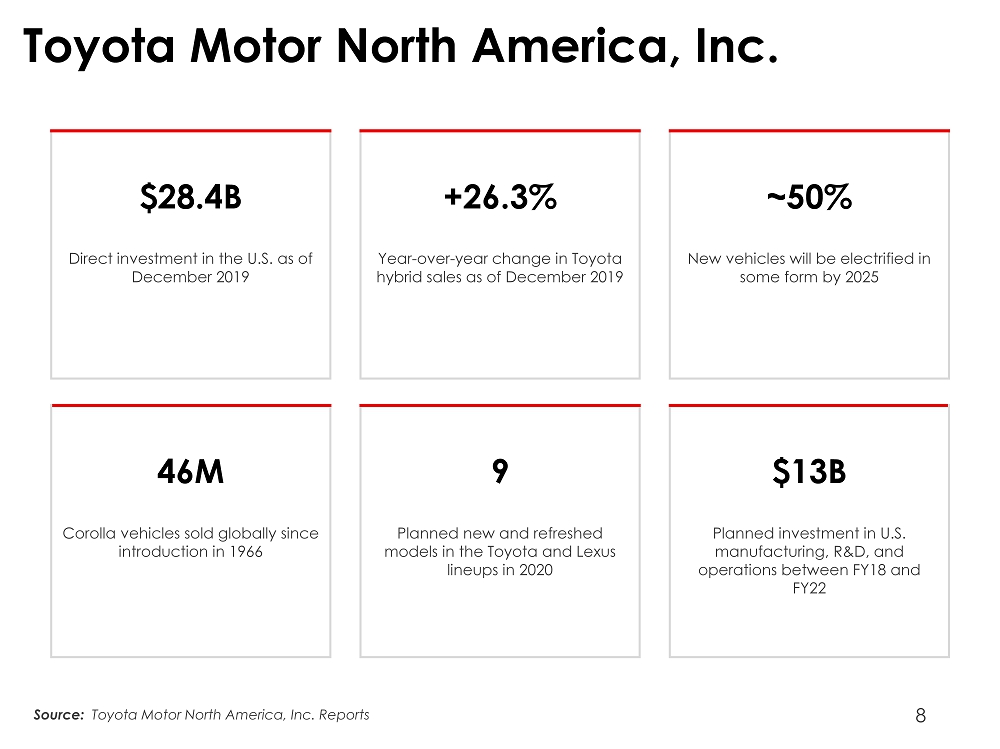
8 Toyota Motor North America, Inc. $28.4B Direct investment in the U.S. as of December 2019 +26.3% Year - over - year change in Toyota hybrid sales as of December 2019 ~50% New vehicles will be electrified in some form by 2025 46M Corolla vehicles sold globally since introduction in 1966 9 Planned new and refreshed models in the Toyota and Lexus lineups in 2020 $13B Planned investment in U.S. manufacturing, R&D, and operations between FY18 and FY22 Source: Toyota Motor North America, Inc. Reports
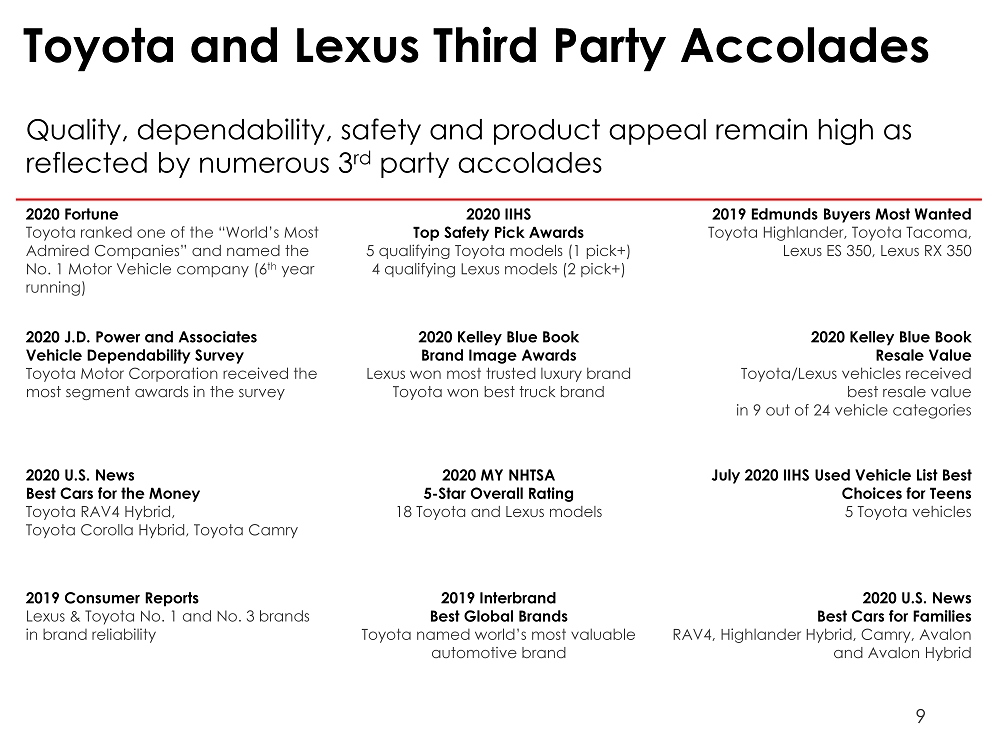
9 Toyota and Lexus Third Party Accolades Quality, dependability, safety and product appeal remain high as reflected by numerous 3 rd party accolades 2020 Fortune Toyota ranked one of the “World’s Most Admired Companies” and named the No. 1 Motor Vehicle company (6 th year running) 2020 IIHS Top Safety Pick Awards 5 qualifying Toyota models (1 pick+) 4 qualifying Lexus models (2 pick+) 2019 Edmunds Buyers Most Wanted Toyota Highlander, Toyota Tacoma, Lexus ES 350, Lexus RX 350 2020 J.D. Power and Associates Vehicle Dependability Survey Toyota Motor Corporation received the most segment awards in the survey 2020 Kelley Blue Book Brand Image Awards Lexus won most trusted luxury brand Toyota won best truck brand 2020 Kelley Blue Book Resale Value Toyota/Lexus vehicles received best resale value in 9 out of 24 vehicle categories 2020 U.S. News Best Cars for the Money Toyota RAV4 Hybrid, Toyota Corolla Hybrid, Toyota Camry 2020 MY NHTSA 5 - Star Overall Rating 18 Toyota and Lexus models July 2020 IIHS Used Vehicle List Best Choices for Teens 5 Toyota vehicles 2019 Consumer Reports Lexus & Toyota No. 1 and No. 3 brands in brand reliability 2019 Interbrand Best Global Brands Toyota named world’s most valuable automotive brand 2020 U.S. News Best Cars for Families RAV4, Highlander Hybrid, Camry, Avalon and Avalon Hybrid
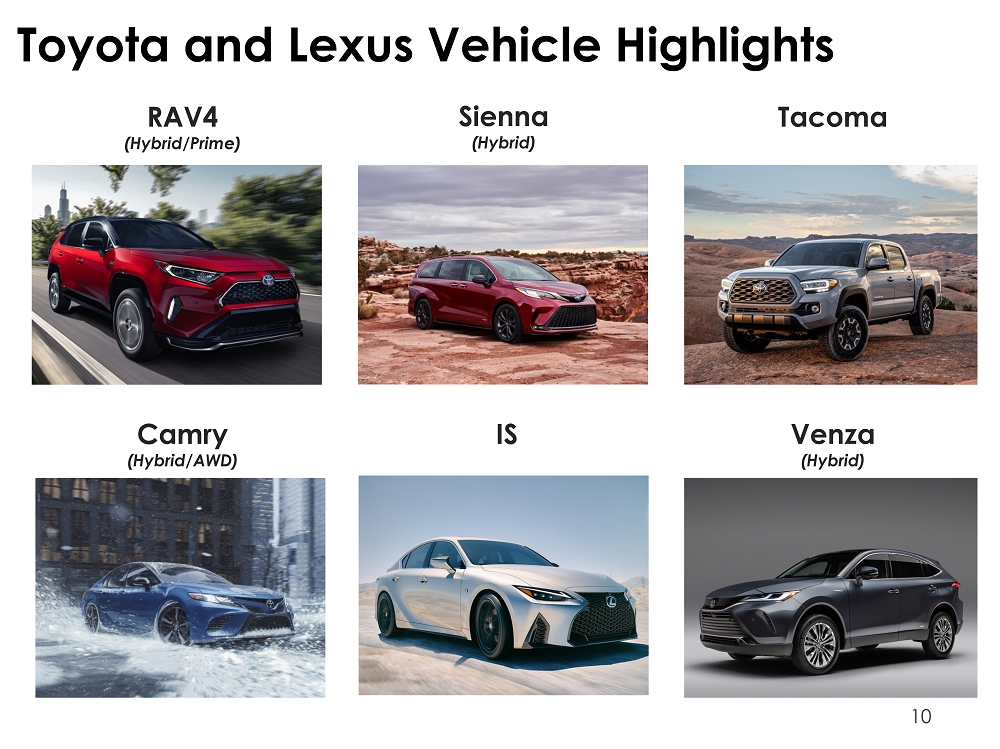
10 Toyota and Lexus Vehicle Highlights RAV4 (Hybrid/Prime) Sienna (Hybrid) Tacoma Camry (Hybrid/AWD) IS Venza (Hybrid)
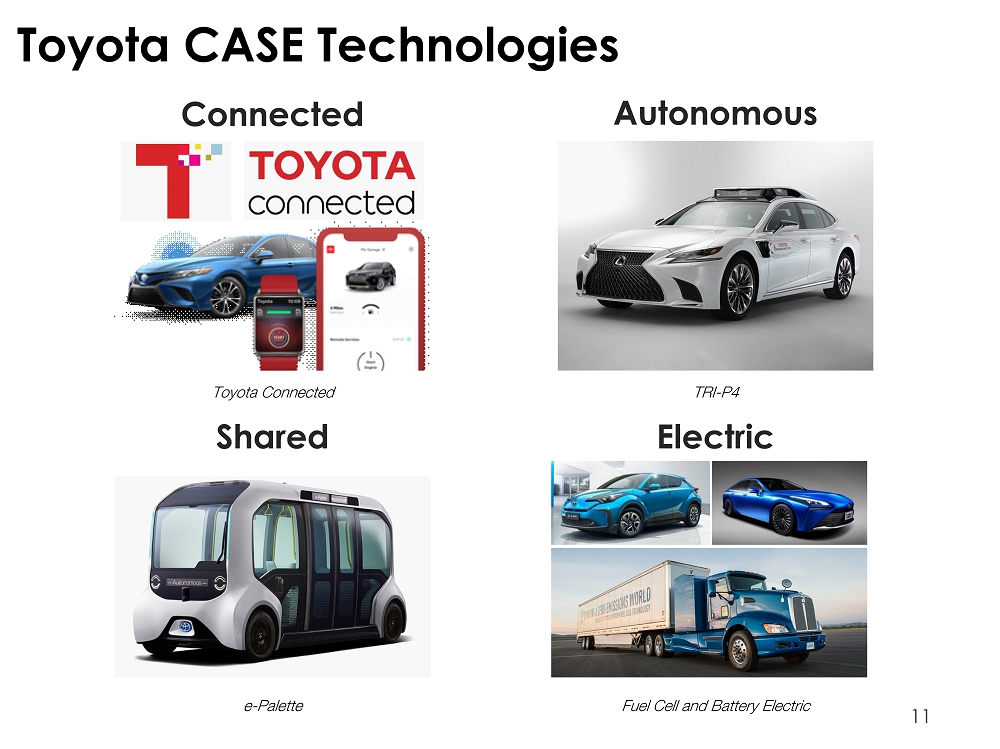
11 Toyota CASE Technologies Toyota Connected TRI - P4 e - Palette Fuel Cell and Battery Electric Connected Autonomous Shared Electric
12 Toyota Financial Services
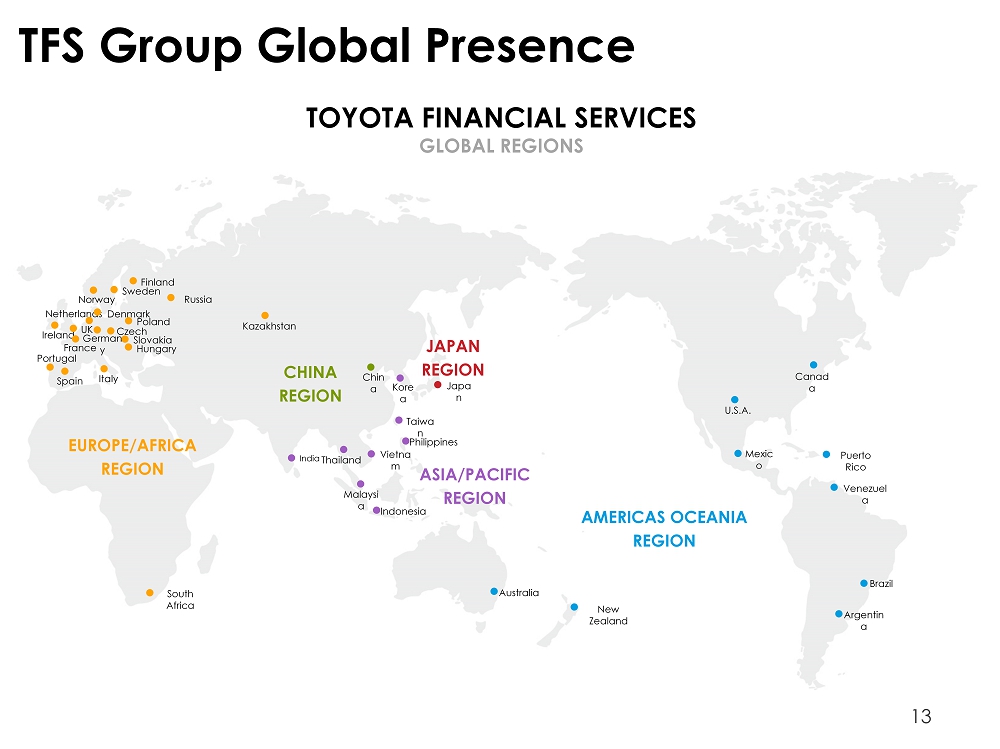
13 TFS Group Global Presence JAPAN REGION EUROPE/AFRICA REGION CHINA REGION ASIA/PACIFIC REGION AMERICAS OCEANIA REGION Finland Sweden Norway Denmark Vietna m Netherlands Ireland German y UK France Czech Poland Slovakia Hungary Portugal Spain Italy Kazakhstan Chin a Kore a Japa n Taiwa n India Thailand Russia Philippines Malaysi a Indonesia South Africa Australia New Zealand Argentin a Brazil Venezuel a Mexic o Puerto Rico Canad a U.S.A. TOYOTA FINANCIAL SERVICES GLOBAL REGIONS
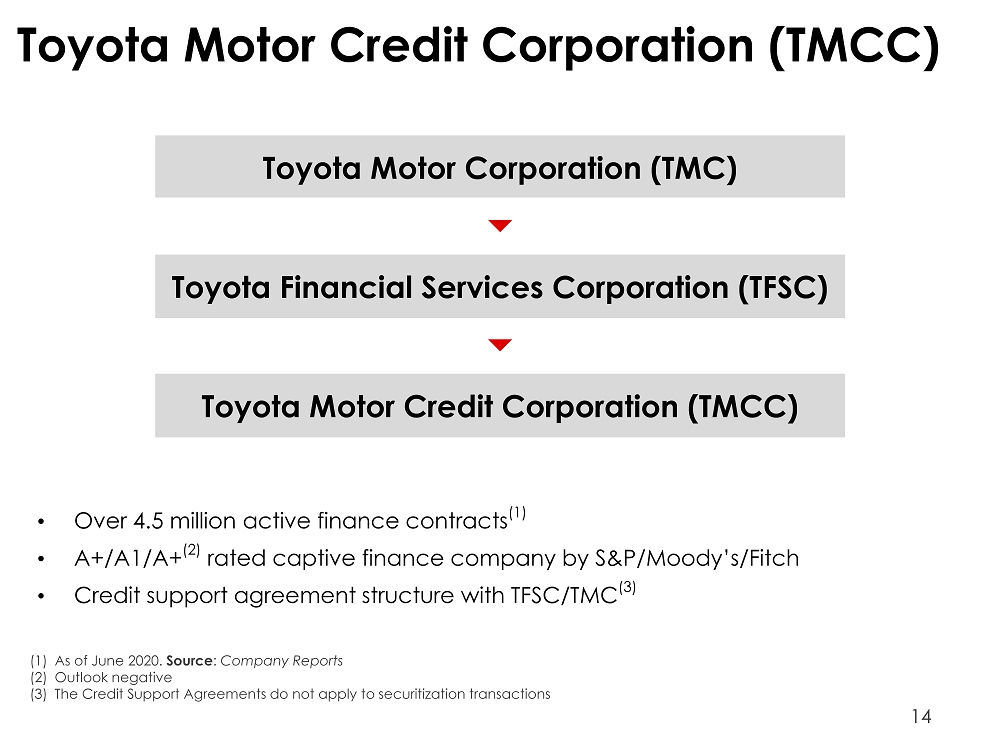
14 Toyota Motor Credit Corporation (TMCC) Toyota Motor Corporation (TMC) Toyota Financial Services Corporation (TFSC) Toyota Motor Credit Corporation (TMCC) • Over 4.5 million active finance contracts (1) • A+/A1/A+ (2) rated captive finance company by S&P/Moody’s/Fitch • Credit support agreement structure with TFSC/TMC (3) (1) As of June 2020. Source : Company Reports (2) Outlook negative (3) The Credit Support Agreements do not apply to securitization transactions
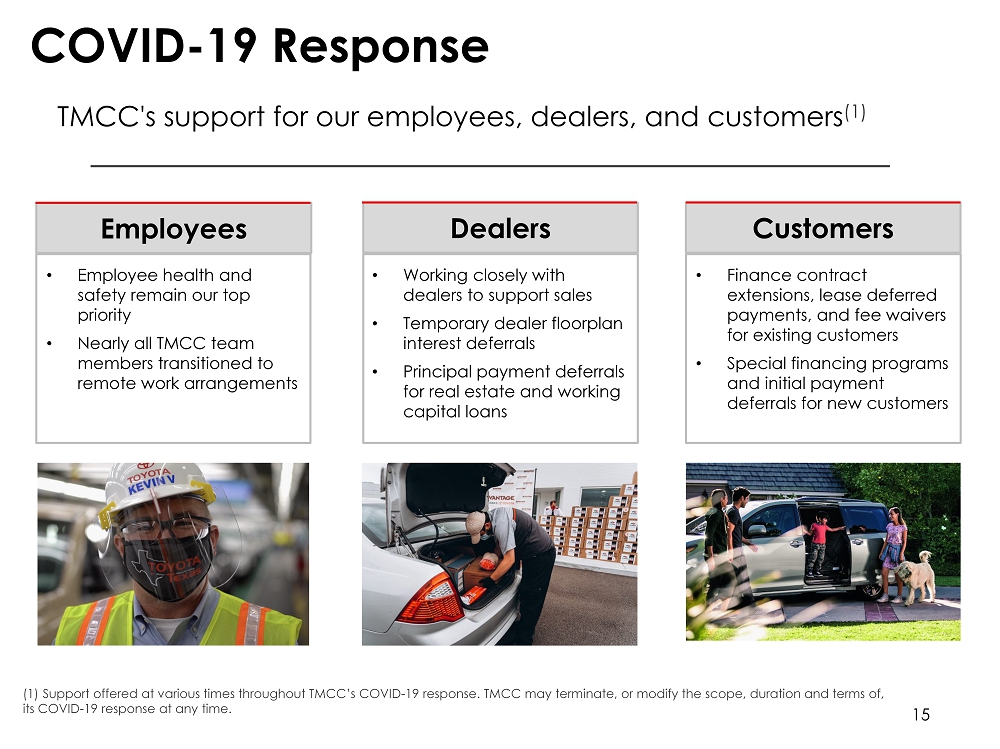
• Working closely with dealers to support sales • Temporary dealer floorplan interest deferrals • Principal payment deferrals for real estate and working capital loans Employees 15 COVID - 19 Response Dealers TMCC's support for our employees, dealers, and customers (1) • Employee health and safety remain our top priority • Nearly all TMCC team members transitioned to remote work arrangements Customers • Finance contract extensions, lease deferred payments, and fee waivers for existing customers • Special financing programs and initial payment deferrals for new customers (1) Support offered at various times throughout TMCC’s COVID - 19 response. TMCC may terminate, or modify the scope, duration and terms of, its COVID - 19 response at any time.
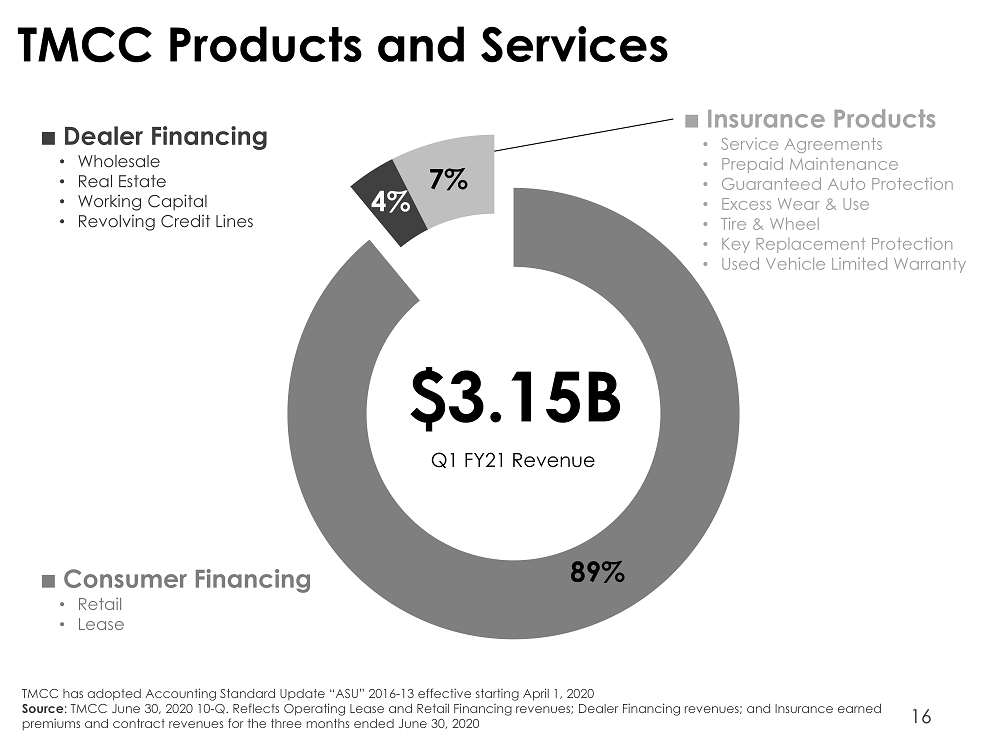
16 TMCC Products and Services ʄ Dealer Financing • Wholesale • Real Estate • Working Capital • Revolving Credit Lines ʄ Consumer Financing • Retail • Lease ʄ Insurance Products • Service Agreements • Prepaid Maintenance • Guaranteed Auto Protection • Excess Wear & Use • Tire & Wheel • Key Replacement Protection • Used Vehicle Limited Warranty TMCC has adopted Accounting Standard Update “ASU” 2016 - 13 effective starting April 1, 2020 Source : TMCC June 30, 2020 10 - Q. Reflects Operating Lease and Retail Financing revenues; Dealer Financing revenues; and Insurance earn ed premiums and contract revenues for the three months ended June 30, 2020 89% 4% 7% $3.15B Q1 FY21 Revenue
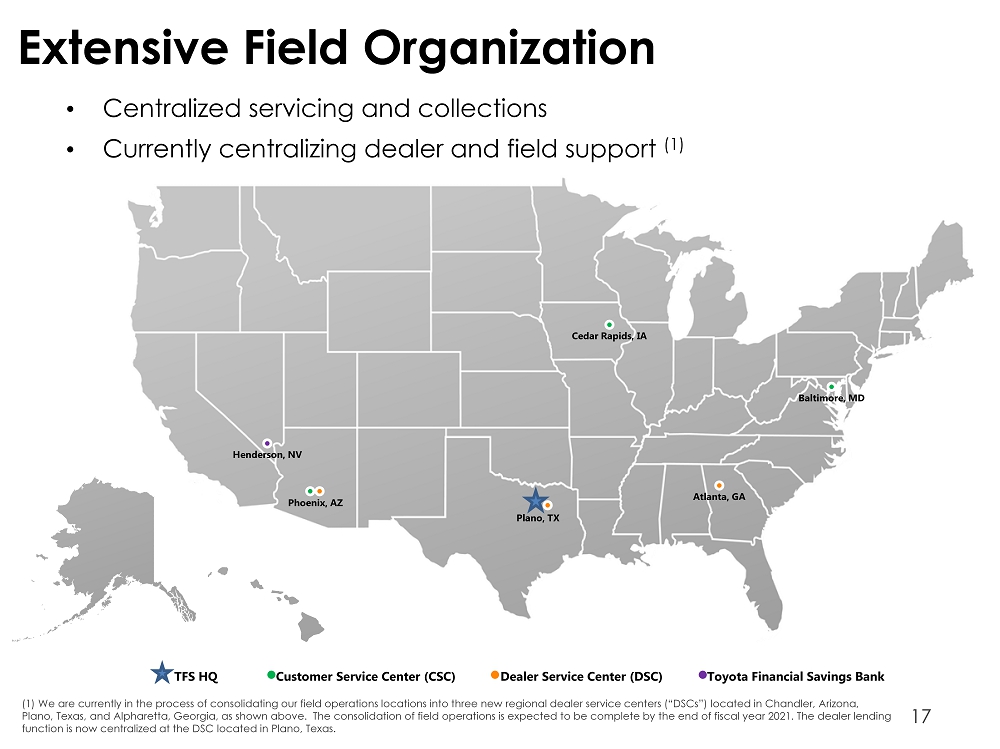
17 Extensive Field Organization • Centralized servicing and collections • Currently centralizing dealer and field support (1) Plano, TX Phoenix, AZ Cedar Rapids, IA Baltimore, MD Atlanta, GA Henderson, NV TFS HQ Customer Service Center (CSC) Dealer Service Center (DSC) Toyota Financial Savings Bank (1) We are currently in the process of consolidating our field operations locations into three new regional dealer service ce nte rs (“DSCs”) located in Chandler, Arizona, Plano, Texas, and Alpharetta, Georgia, as shown above. The consolidation of field operations is expected to be complete by t he end of fiscal year 2021. The dealer lending function is now centralized at the DSC located in Plano, Texas.
38.1 38.7 37.9 36.4 35.8 50.7 52.3 53.0 56.4 57.7 17.8 17.3 17.5 17.6 13.4 $106.6 $108.3 $108.4 $110.4 $106.9 Mar-17 Mar-18 Mar-19 Mar-20 Jun-20 Total Managed Assets Lease Retail Wholesale 37.8 40.4 41.9 44.0 41.5 12.9 11.9 11.1 12.4 16.2 $50.7 $52.3 $53.0 $56.4 $57.7 Mar-17 Mar-18 Mar-19 Mar-20 Jun-20 % Unencumbered 75% 77% 79% 78% 72% Total $50.700 $52.300 $53.000 $56.400 $57.700 Sold Retail $12.9 $11.9 $11.1 $12.4 $16.2 Retail $37.8 $40.4 $41.9 $44.0 $41.5 Retail Assets Sold Retail Retail 33.2 33.0 32.6 30.8 29.1 4.9 5.7 5.3 5.6 6.7 $38.1 $38.7 $37.9 $36.4 $35.8 Mar-17 Mar-18 Mar-19 Mar-20 Jun-20 % Unencumbered 87% 85% 86% 85% 81% Total $38.100 $38.700 $37.900 $36.400 $35.800 Sold Lease $4.9 $5.7 $5.3 $5.6 $6.7 Lease $33.2 $33.0 $32.6 $30.8 $29.1 Lease Assets Sold Lease Lease TMCC Earning Asset Composition 18 $ in billions TMCC has adopted Accounting Standard Update “ASU” 2016 - 13 effective starting April 1, 2020 Source: TMCC March 31, 2017 10 - K, March 31, 2019 10 - K, March 31, 2020 10 - K, & June 30, 2020 10 - Q
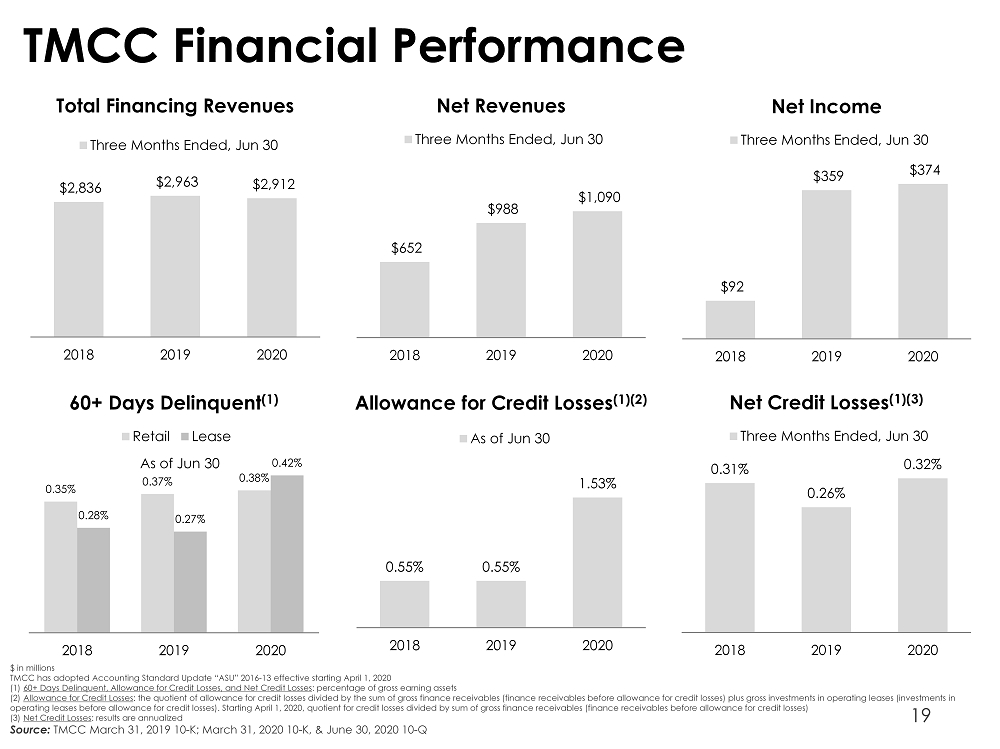
19 TMCC Financial Performance $ in millions TMCC has adopted Accounting Standard Update “ASU” 2016 - 13 effective starting April 1, 2020 (1) 60+ Days Delinquent, Allowance for Credit Losses, and Net Credit Losses : percentage of gross earning assets (2) Allowance for Credit Losses : the quotient of allowance for credit losses divided by the sum of gross finance receivables (finance receivables before all owa nce for credit losses) plus gross investments in operating leases (investments in operating leases before allowance for credit losses). Starting April 1, 2020, quotient for credit losses divided by sum of gr oss finance receivables (finance receivables before allowance for credit losses) (3) Net Credit Losses : results are annualized Source: TMCC March 31, 2019 10 - K; March 31, 2020 10 - K, & June 30, 2020 10 - Q $2,836 $2,963 $2,912 2018 2019 2020 Three Months Ended, Jun 30 Total Financing Revenues $652 $988 $1,090 2018 2019 2020 Net Revenues Three Months Ended, Jun 30 $92 $359 $374 2018 2019 2020 Net Income Three Months Ended, Jun 30 0.35% 0.37% 0.38% 0.28% 0.27% 0.42% 2018 2019 2020 60+ Days Delinquent (1) Retail Lease As of Jun 30 0.55% 0.55% 1.53% 2018 2019 2020 As of Jun 30 Allowance for Credit Losses (1)(2) 0.31% 0.26% 0.32% 2018 2019 2020 Net Credit Losses (1)(3) Three Months Ended, Jun 30
20 TMCC Funding Programs
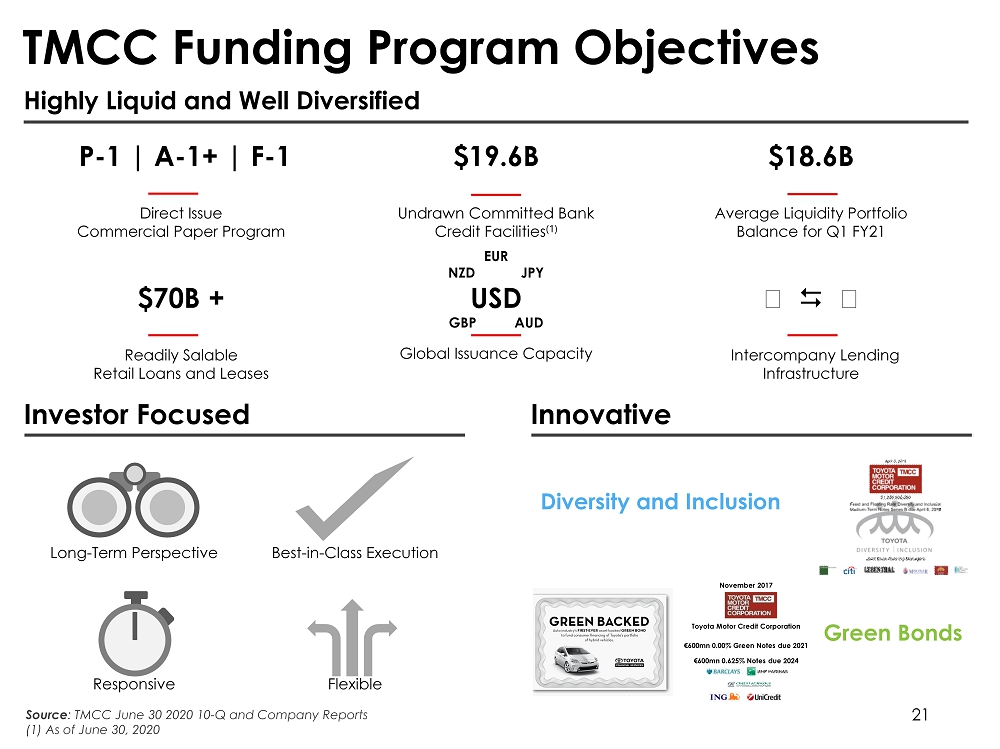
21 TMCC Funding Program Objectives Highly Liquid and Well Diversified P - 1 | A - 1+ | F - 1 . Direct Issue Commercial Paper Program $19.6B Undrawn Committed Bank Credit Facilities (1) $18.6B Average Liquidity Portfolio Balance for Q1 FY21 $70B + Readily Salable Retail Loans and Leases EUR NZD JPY USD GBP AUD Global Issuance Capacity Intercompany Lending Infrastructure Investor Focused Long - Term Perspective Best - in - Class Execution Responsive Flexible Innovative Diversity and Inclusion Green Bonds November 2017 Toyota Motor Credit Corporation €600mn 0.00% Green Notes due 2021 €600mn 0.625% Notes due 2024 Source : TMCC June 30 2020 10 - Q and Company Reports (1) As of June 30, 2020
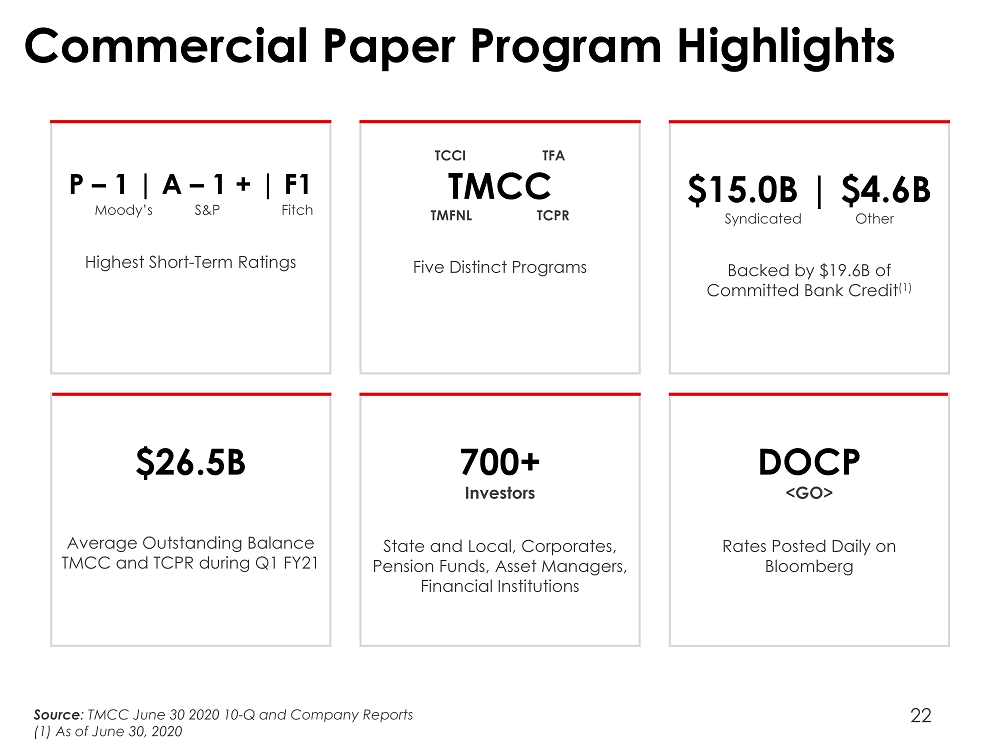
22 Commercial Paper Program Highlights P – 1 | A – 1 + | F1 Moody’s S&P Fitch Highest Short - Term Ratings TCCI TFA TMCC TMFNL TCPR Five Distinct Programs $15.0B | $4.6B Syndicated Other Backed by $19.6B of Committed Bank Credit (1) $26.5B Average Outstanding Balance TMCC and TCPR during Q1 FY21 700+ Investors State and Local, Corporates, Pension Funds, Asset Managers, Financial Institutions DOCP <GO> Rates Posted Daily on Bloomberg Source : TMCC June 30 2020 10 - Q and Company Reports (1) As of June 30, 2020
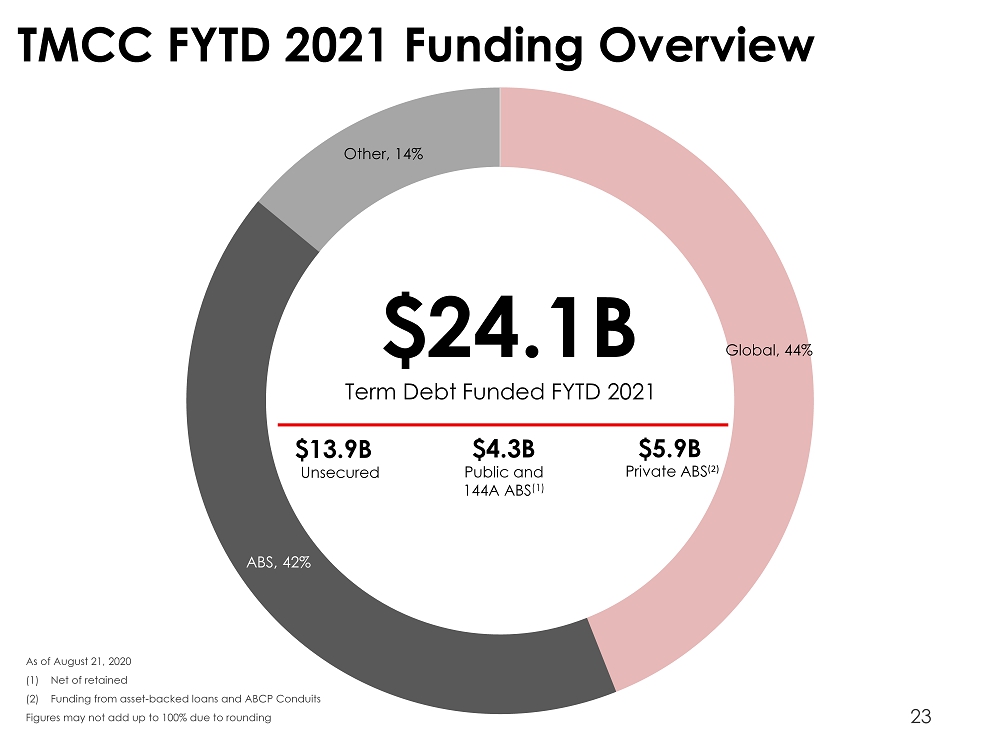
Global , 44% ABS , 42% Other , 14% $24.1B Term Debt Funded FYTD 2021 $13.9B $4.3B $5.9B Unsecured Public and 144A ABS (1) Private ABS (2) 23 TMCC FYTD 2021 Funding Overview As of August 21, 2020 (1) Net of retained (2) Funding from asset - backed loans and ABCP Conduits Figures may not add up to 100% due to rounding
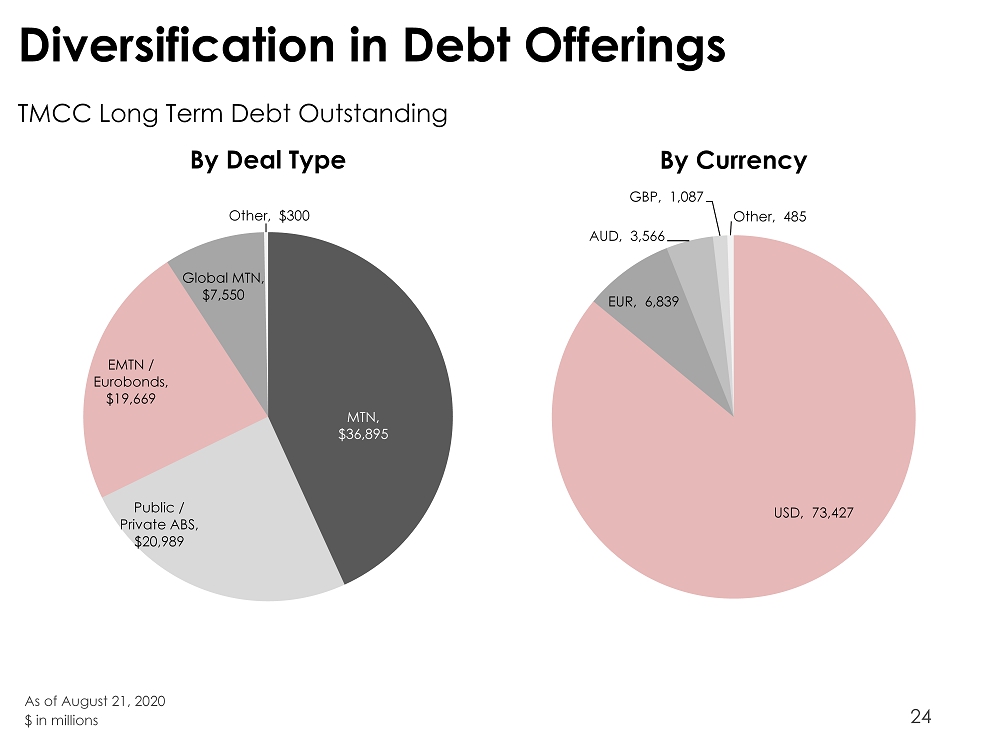
24 Diversification in Debt Offerings TMCC Long Term Debt Outstanding As of August 21, 2020 $ in millions MTN , $36,895 Public / Private ABS , $20,989 EMTN / Eurobonds , $19,669 Global MTN , $7,550 Other , $300 By Deal Type USD , 73,427 EUR , 6,839 AUD , 3,566 GBP , 1,087 Other , 485 By Currency
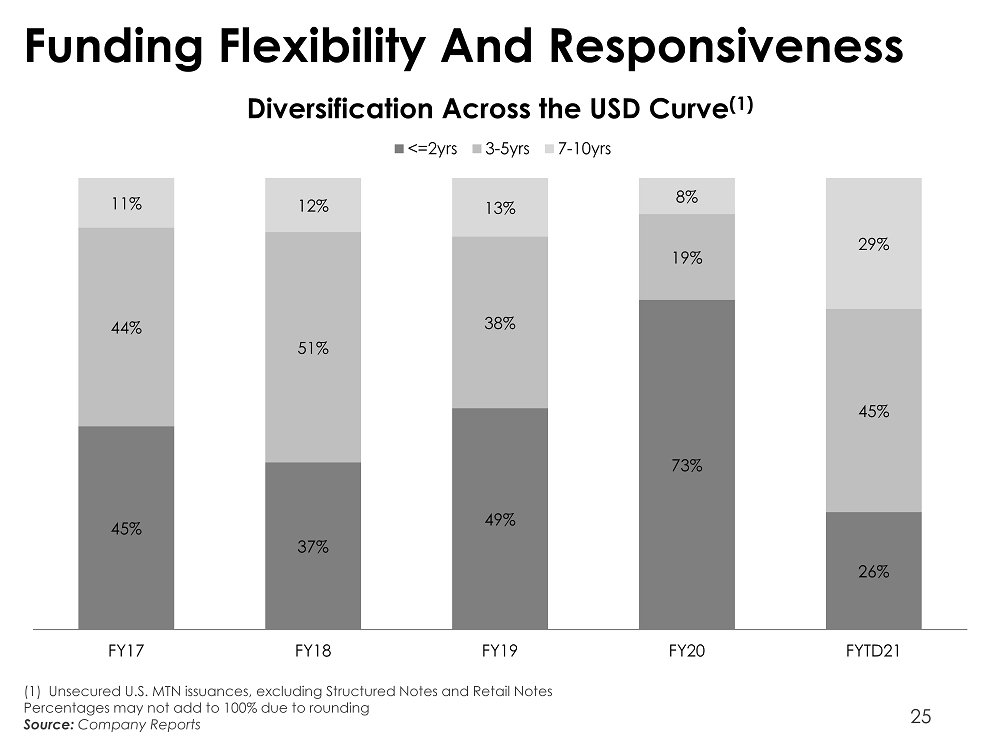
25 Funding Flexibility And Responsiveness (1) Unsecured U.S. MTN issuances, excluding Structured Notes and Retail Notes Percentages may not add to 100% due to rounding Source: Company Reports 45% 37% 49% 73% 26% 44% 51% 38% 19% 45% 11% 12% 13% 8% 29% FY17 FY18 FY19 FY20 FYTD21 Diversification Across the USD Curve (1) <=2yrs 3-5yrs 7-10yrs

TMCC Retail Loan Collateral & ABS Transactions 26
27 Credit Decisioning & Collections Disciplined Underwriting Consistent and conservative underwriting standards designed to limit delinquencies and credit losses • Key mission is to support Toyota and Lexus brand and vehicle sales • Continued focus on prime originations • Proprietary credit scores that leverage TMCC’s extensive origination history • Regular statistical validations of predictive power Servicing Optimization Optimization of collections strategy and staff supports loss mitigation while enabling portfolio growth • Emphasis on early intervention • Reinforcement of strong compliance management system • Focus on analytics and technology to prioritize high risk accounts and manage loss severities
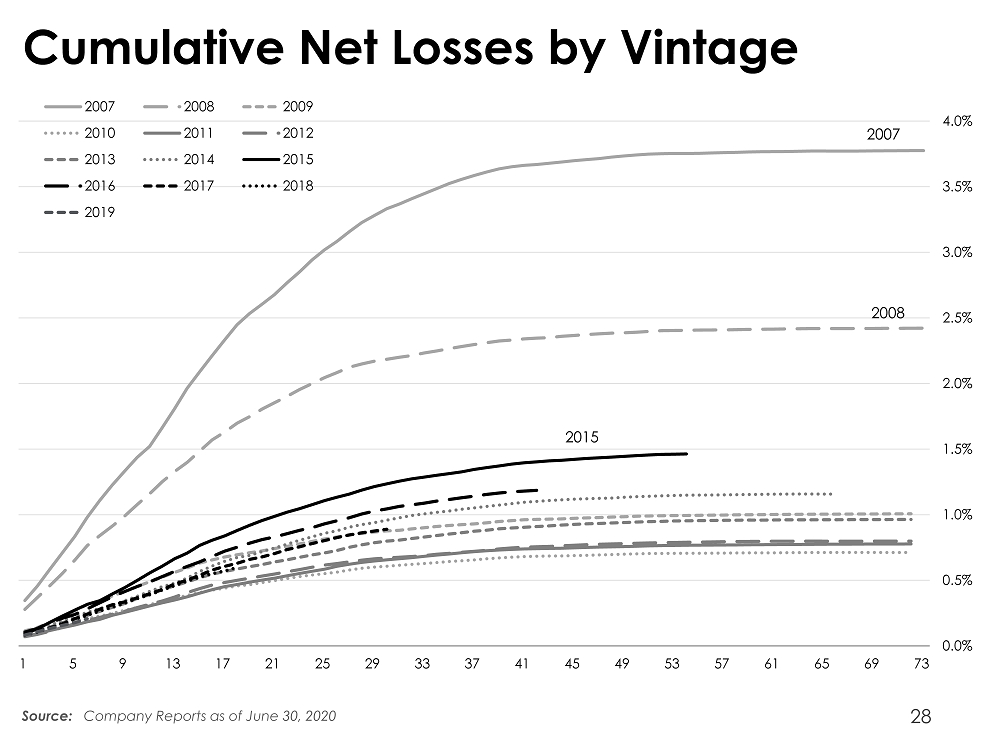
28 Cumulative Net Losses by Vintage Source: Company Reports as of June 30, 2020 0.0% 0.5% 1.0% 1.5% 2.0% 2.5% 3.0% 3.5% 4.0% 1 5 9 13 17 21 25 29 33 37 41 45 49 53 57 61 65 69 73 2007 2008 2009 2010 2011 2012 2013 2014 2015 2016 2017 2018 2019 2015 2007 2008
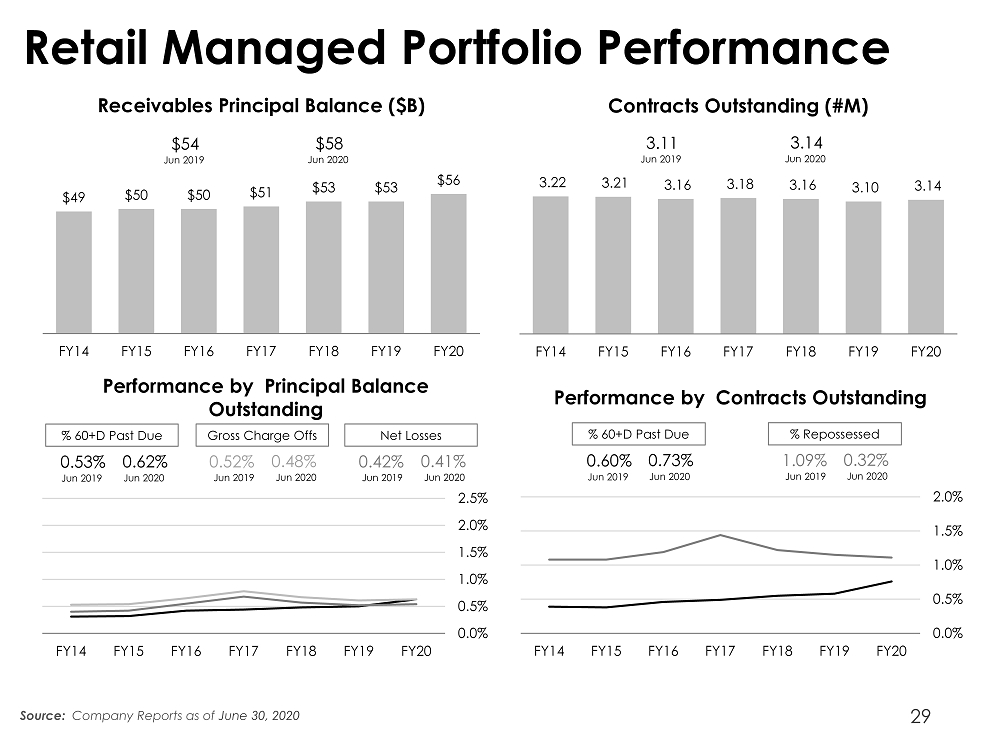
29 Retail Managed Portfolio Performance Source: Company Reports as of June 30, 2020 $56 $53 $53 $51 $50 $50 $49 FY20 FY19 FY18 FY17 FY16 FY15 FY14 Receivables Principal Balance ($B) $54 $58 Jun 2019 Jun 2020 3.14 3.10 3.16 3.18 3.16 3.21 3.22 FY20 FY19 FY18 FY17 FY16 FY15 FY14 Contracts Outstanding (#M) 3.11 3.14 Jun 2019 Jun 2020 0.0% 0.5% 1.0% 1.5% 2.0% 2.5% FY20 FY19 FY18 FY17 FY16 FY15 FY14 0.53% 0.62% 0.52% 0.48% 0.42% 0.41% Jun 2019 Jun 2020 Jun 2019 Jun 2020 Jun 2019 Jun 2020 % 60+D Past Due Gross Charge Offs Net Losses Performance by Principal Balance Outstanding 0.0% 0.5% 1.0% 1.5% 2.0% FY20 FY19 FY18 FY17 FY16 FY15 FY14 0.60% 0.73% 1.09% 0.32% Jun 2019 Jun 2020 Jun 2019 Jun 2020 % 60+D Past Due % Repossessed Performance by Contracts Outstanding
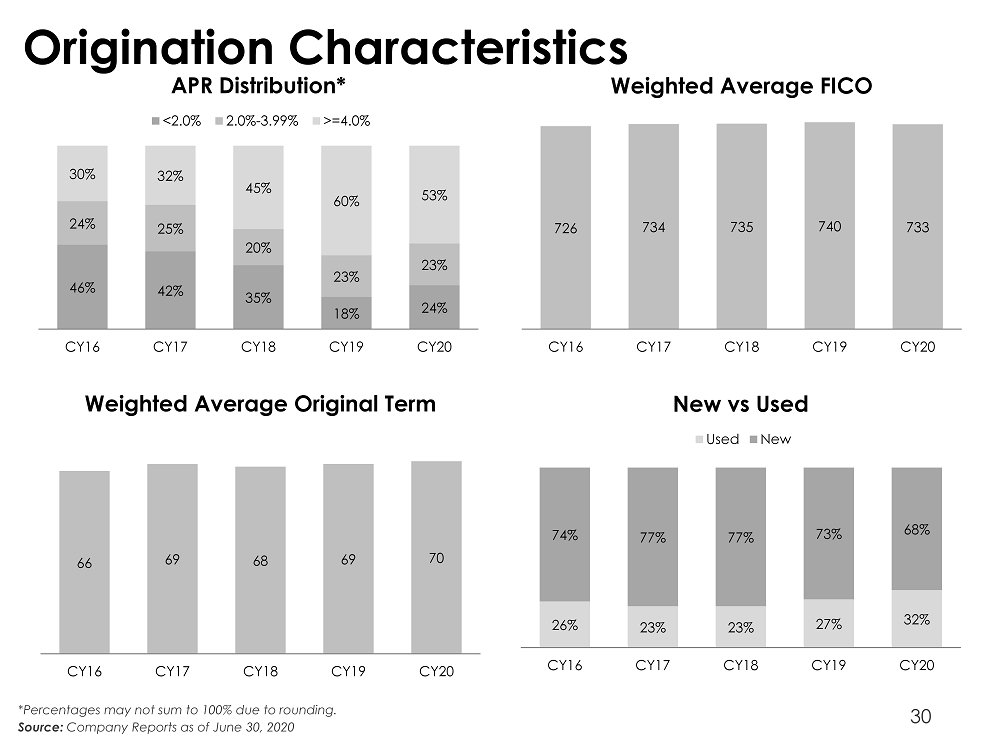
30 Origination Characteristics *Percentages may not sum to 100% due to rounding. Source: Company Reports as of June 30, 2020 46% 42% 35% 18% 24% 24% 25% 20% 23% 23% 30% 32% 45% 60% 53% CY16 CY17 CY18 CY19 CY20 APR Distribution* <2.0% 2.0%-3.99% >=4.0% 726 734 735 740 733 CY16 CY17 CY18 CY19 CY20 Weighted Average FICO 66 69 68 69 70 CY16 CY17 CY18 CY19 CY20 Weighted Average Original Term 26% 23% 23% 27% 32% 74% 77% 77% 73% 68% CY16 CY17 CY18 CY19 CY20 New vs Used Used New
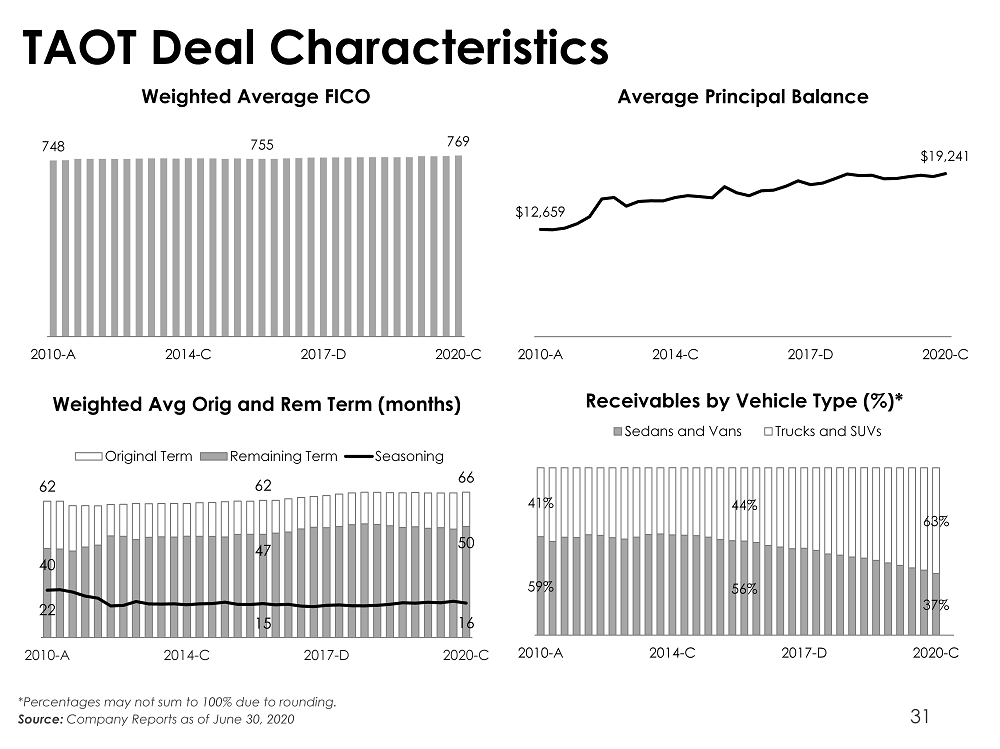
31 TAOT Deal Characteristics *Percentages may not sum to 100% due to rounding. Source: Company Reports as of June 30, 2020 748 755 769 2010-A 2014-C 2017-D 2020-C Weighted Average FICO $12,659 $19,241 2010-A 2014-C 2017-D 2020-C Average Principal Balance 62 62 66 40 47 50 22 15 16 2010-A 2014-C 2017-D 2020-C Original Term Remaining Term Seasoning Weighted Avg Orig and Rem Term (months) 59% 56% 37% 41% 44% 63% 2010-A 2014-C 2017-D 2020-C Receivables by Vehicle Type (%)* Sedans and Vans Trucks and SUVs
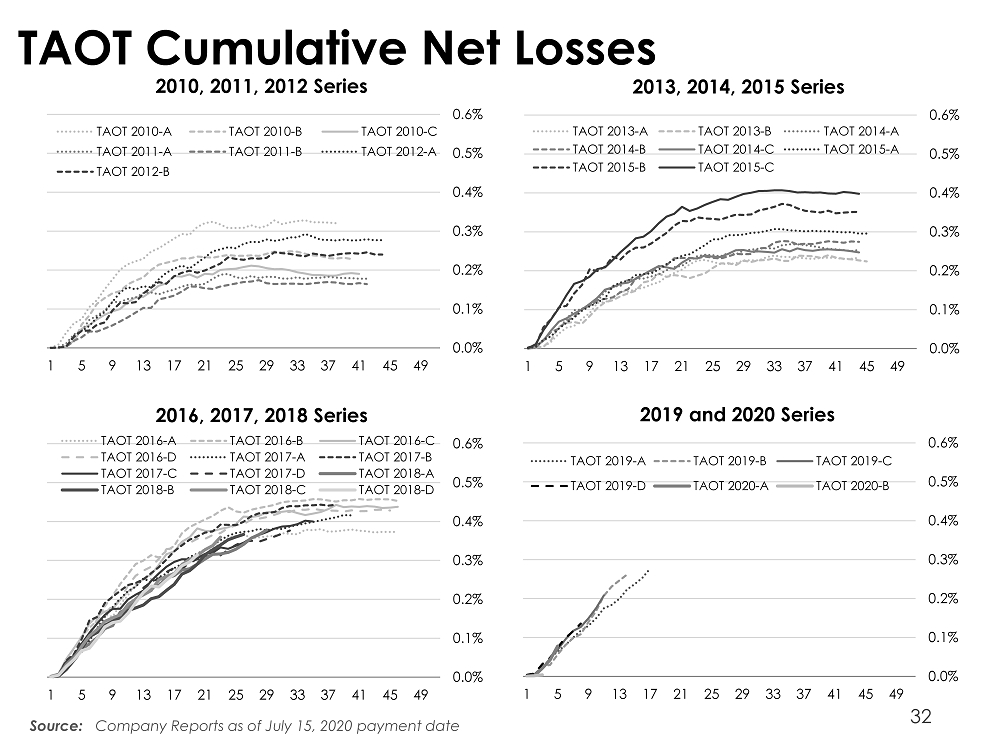
32 TAOT Cumulative Net Losses Source: Company Reports as of July 15, 2020 payment date 0.0% 0.1% 0.2% 0.3% 0.4% 0.5% 0.6% 1 5 9 13 17 21 25 29 33 37 41 45 49 2010, 2011, 2012 Series TAOT 2010-A TAOT 2010-B TAOT 2010-C TAOT 2011-A TAOT 2011-B TAOT 2012-A TAOT 2012-B 0.0% 0.1% 0.2% 0.3% 0.4% 0.5% 0.6% 1 5 9 13 17 21 25 29 33 37 41 45 49 2013, 2014, 2015 Series TAOT 2013-A TAOT 2013-B TAOT 2014-A TAOT 2014-B TAOT 2014-C TAOT 2015-A TAOT 2015-B TAOT 2015-C 0.0% 0.1% 0.2% 0.3% 0.4% 0.5% 0.6% 1 5 9 13 17 21 25 29 33 37 41 45 49 2016, 2017, 2018 Series TAOT 2016-A TAOT 2016-B TAOT 2016-C TAOT 2016-D TAOT 2017-A TAOT 2017-B TAOT 2017-C TAOT 2017-D TAOT 2018-A TAOT 2018-B TAOT 2018-C TAOT 2018-D 0.0% 0.1% 0.2% 0.3% 0.4% 0.5% 0.6% 1 5 9 13 17 21 25 29 33 37 41 45 49 2019 and 2020 Series TAOT 2019-A TAOT 2019-B TAOT 2019-C TAOT 2019-D TAOT 2020-A TAOT 2020-B
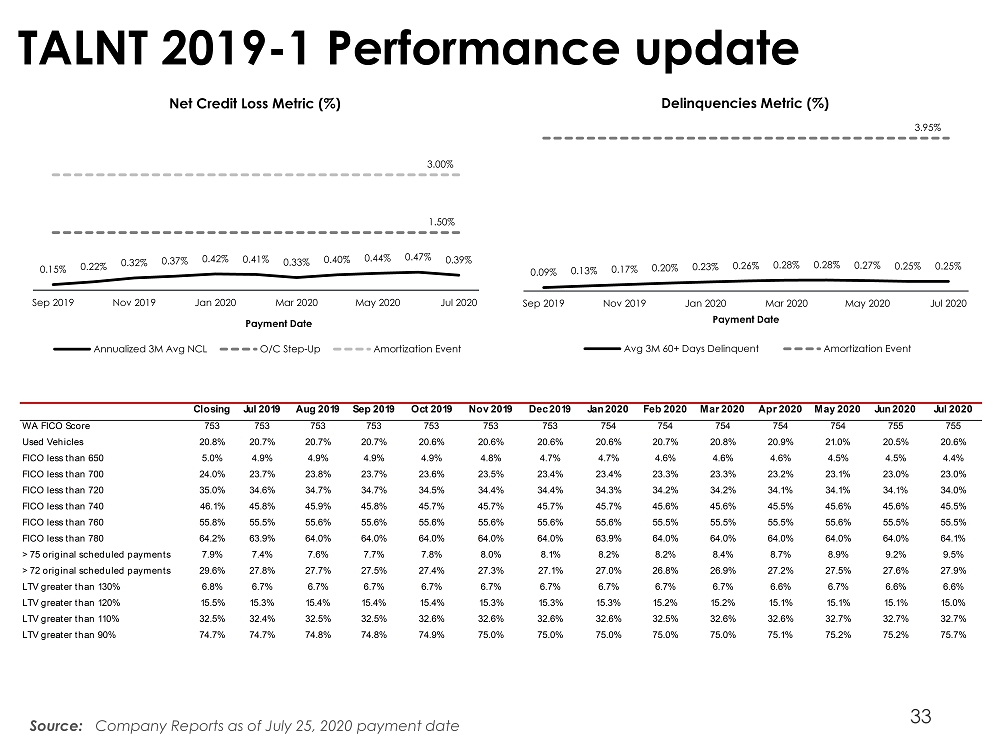
33 TALNT 2019 - 1 Performance update Source: Company Reports as of July 25, 2020 payment date Closing Jul 2019 Aug 2019 Sep 2019 Oct 2019 Nov 2019 Dec 2019 Jan 2020 Feb 2020 Mar 2020 Apr 2020 May 2020 Jun 2020 Jul 2020 WA FICO Score 753 753 753 753 753 753 753 754 754 754 754 754 755 755 Used Vehicles 20.8% 20.7% 20.7% 20.7% 20.6% 20.6% 20.6% 20.6% 20.7% 20.8% 20.9% 21.0% 20.5% 20.6% FICO less than 650 5.0% 4.9% 4.9% 4.9% 4.9% 4.8% 4.7% 4.7% 4.6% 4.6% 4.6% 4.5% 4.5% 4.4% FICO less than 700 24.0% 23.7% 23.8% 23.7% 23.6% 23.5% 23.4% 23.4% 23.3% 23.3% 23.2% 23.1% 23.0% 23.0% FICO less than 720 35.0% 34.6% 34.7% 34.7% 34.5% 34.4% 34.4% 34.3% 34.2% 34.2% 34.1% 34.1% 34.1% 34.0% FICO less than 740 46.1% 45.8% 45.9% 45.8% 45.7% 45.7% 45.7% 45.7% 45.6% 45.6% 45.5% 45.6% 45.6% 45.5% FICO less than 760 55.8% 55.5% 55.6% 55.6% 55.6% 55.6% 55.6% 55.6% 55.5% 55.5% 55.5% 55.6% 55.5% 55.5% FICO less than 780 64.2% 63.9% 64.0% 64.0% 64.0% 64.0% 64.0% 63.9% 64.0% 64.0% 64.0% 64.0% 64.0% 64.1% > 75 original scheduled payments 7.9% 7.4% 7.6% 7.7% 7.8% 8.0% 8.1% 8.2% 8.2% 8.4% 8.7% 8.9% 9.2% 9.5% > 72 original scheduled payments 29.6% 27.8% 27.7% 27.5% 27.4% 27.3% 27.1% 27.0% 26.8% 26.9% 27.2% 27.5% 27.6% 27.9% LTV greater than 130% 6.8% 6.7% 6.7% 6.7% 6.7% 6.7% 6.7% 6.7% 6.7% 6.7% 6.6% 6.7% 6.6% 6.6% LTV greater than 120% 15.5% 15.3% 15.4% 15.4% 15.4% 15.3% 15.3% 15.3% 15.2% 15.2% 15.1% 15.1% 15.1% 15.0% LTV greater than 110% 32.5% 32.4% 32.5% 32.5% 32.6% 32.6% 32.6% 32.6% 32.5% 32.6% 32.6% 32.7% 32.7% 32.7% LTV greater than 90% 74.7% 74.7% 74.8% 74.8% 74.9% 75.0% 75.0% 75.0% 75.0% 75.0% 75.1% 75.2% 75.2% 75.7% 0.15% 0.22% 0.32% 0.37% 0.42% 0.41% 0.33% 0.40% 0.44% 0.47% 0.39% 1.50% 3.00% Sep 2019 Nov 2019 Jan 2020 Mar 2020 May 2020 Jul 2020 Payment Date Net Credit Loss Metric (%) Annualized 3M Avg NCL O/C Step-Up Amortization Event 0.09% 0.13% 0.17% 0.20% 0.23% 0.26% 0.28% 0.28% 0.27% 0.25% 0.25% 3.95% Sep 2019 Nov 2019 Jan 2020 Mar 2020 May 2020 Jul 2020 Payment Date Delinquencies Metric (%) Avg 3M 60+ Days Delinquent Amortization Event
34 Appendix
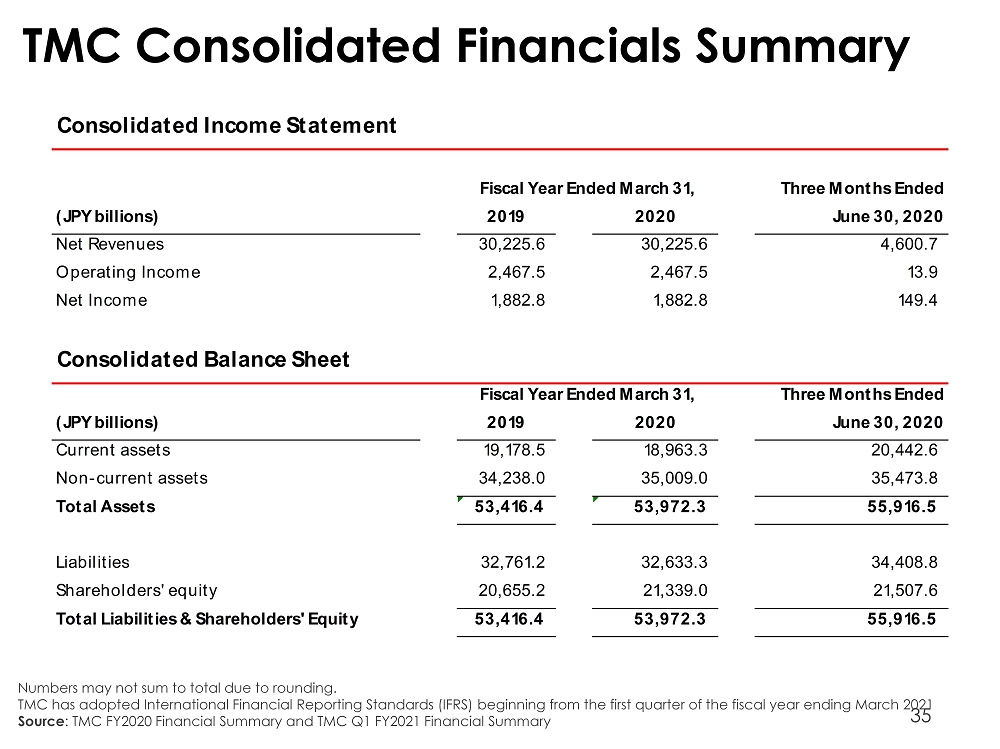
35 TMC Consolidated Financials Summary Numbers may not sum to total due to rounding. TMC has adopted International Financial Reporting Standards (IFRS) beginning from the first quarter of the fiscal year ending Ma rch 2021 Source : TMC FY2020 Financial Summary and TMC Q1 FY2021 Financial Summary Consolidated Income Statement Three Months Ended (JPY billions) 2019 2020 June 30, 2020 Net Revenues 30,225.6 30,225.6 4,600.7 Operating Income 2,467.5 2,467.5 13.9 Net Income 1,882.8 1,882.8 149.4 Consolidated Balance Sheet Three Months Ended (JPY billions) 2019 2020 June 30, 2020 Current assets 19,178.5 18,963.3 20,442.6 Non-current assets 34,238.0 35,009.0 35,473.8 Total Assets 53,416.4 53,972.3 55,916.5 Liabilities 32,761.2 32,633.3 34,408.8 Shareholders' equity 20,655.2 21,339.0 21,507.6 Total Liabilities & Shareholders' Equity 53,416.4 53,972.3 55,916.5 Fiscal Year Ended March 31, Fiscal Year Ended March 31,
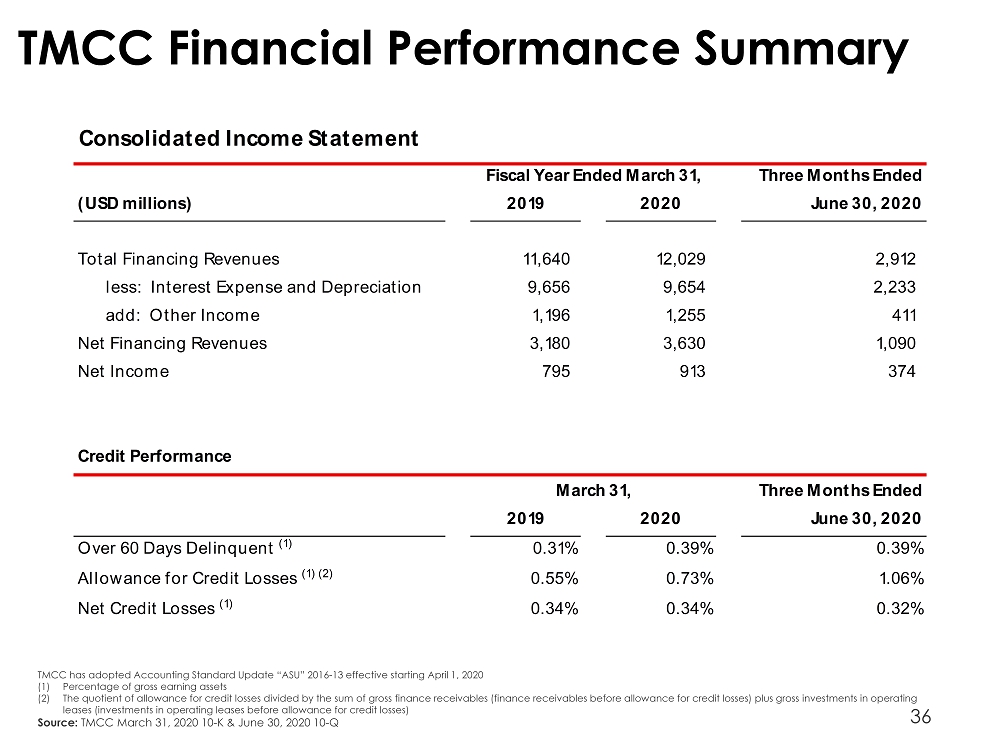
36 TMCC Financial Performance Summary TMCC has adopted Accounting Standard Update “ASU” 2016 - 13 effective starting April 1, 2020 (1) Percentage of gross earning assets (2) The quotient of allowance for credit losses divided by the sum of gross finance receivables (finance receivables before allow anc e for credit losses) plus gross investments in operating leases (investments in operating leases before allowance for credit losses) Source: TMCC March 31, 2020 10 - K & June 30, 2020 10 - Q Consolidated Income Statement Three Months Ended (USD millions) 2019 2020 June 30, 2020 Total Financing Revenues 11,640 12,029 2,912 less: Interest Expense and Depreciation 9,656 9,654 2,233 add: Other Income 1,196 1,255 411 Net Financing Revenues 3,180 3,630 1,090 Net Income 795 913 374 Credit Performance Three Months Ended 2019 2020 June 30, 2020 Over 60 Days Delinquent (1) 0.31% 0.39% 0.39% Allowance for Credit Losses (1) (2) 0.55% 0.73% 1.06% Net Credit Losses (1) 0.34% 0.34% 0.32% Fiscal Year Ended March 31, March 31,
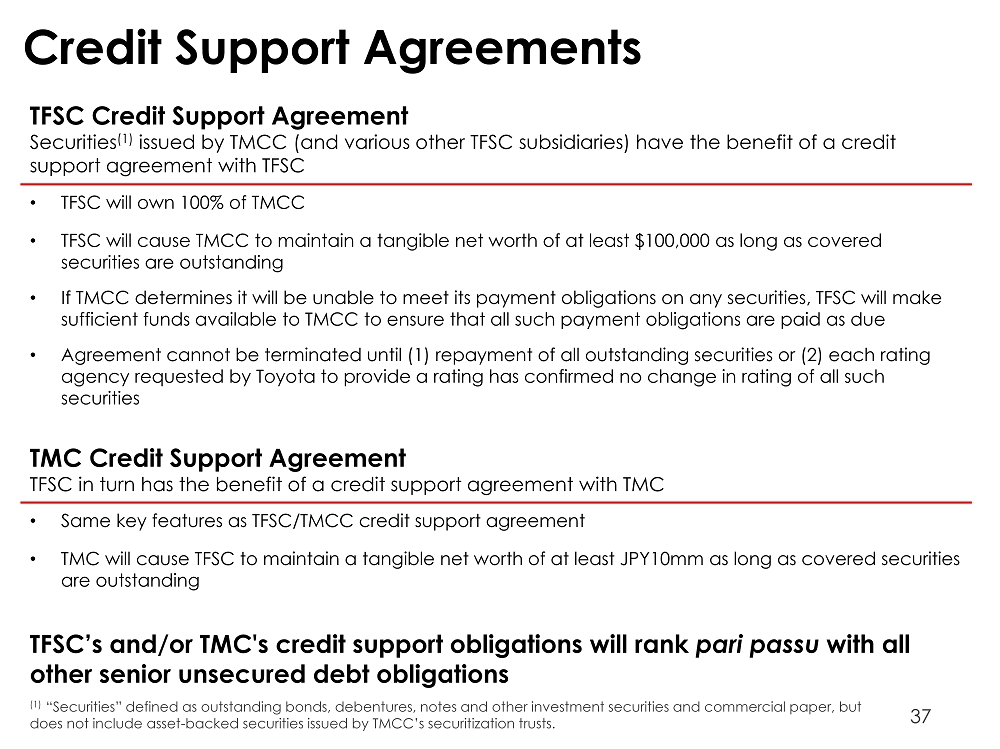
37 Credit Support Agreements TFSC Credit Support Agreement Securities (1) issued by TMCC (and various other TFSC subsidiaries) have the benefit of a credit support agreement with TFSC • TFSC will own 100% of TMCC • TFSC will cause TMCC to maintain a tangible net worth of at least $100,000 as long as covered securities are outstanding • If TMCC determines it will be unable to meet its payment obligations on any securities, TFSC will make sufficient funds available to TMCC to ensure that all such payment obligations are paid as due • Agreement cannot be terminated until (1) repayment of all outstanding securities or (2) each rating agency requested by Toyota to provide a rating has confirmed no change in rating of all such securities TMC Credit Support Agreement TFSC in turn has the benefit of a credit support agreement with TMC • Same key features as TFSC/TMCC credit support agreement • TMC will cause TFSC to maintain a tangible net worth of at least JPY10mm as long as covered securities are outstanding TFSC’s and/or TMC's credit support obligations will rank pari passu with all other senior unsecured debt obligations (1) “Securities” defined as outstanding bonds, debentures, notes and other investment securities and commercial paper, but does not include asset - backed securities issued by TMCC’s securitization trusts.
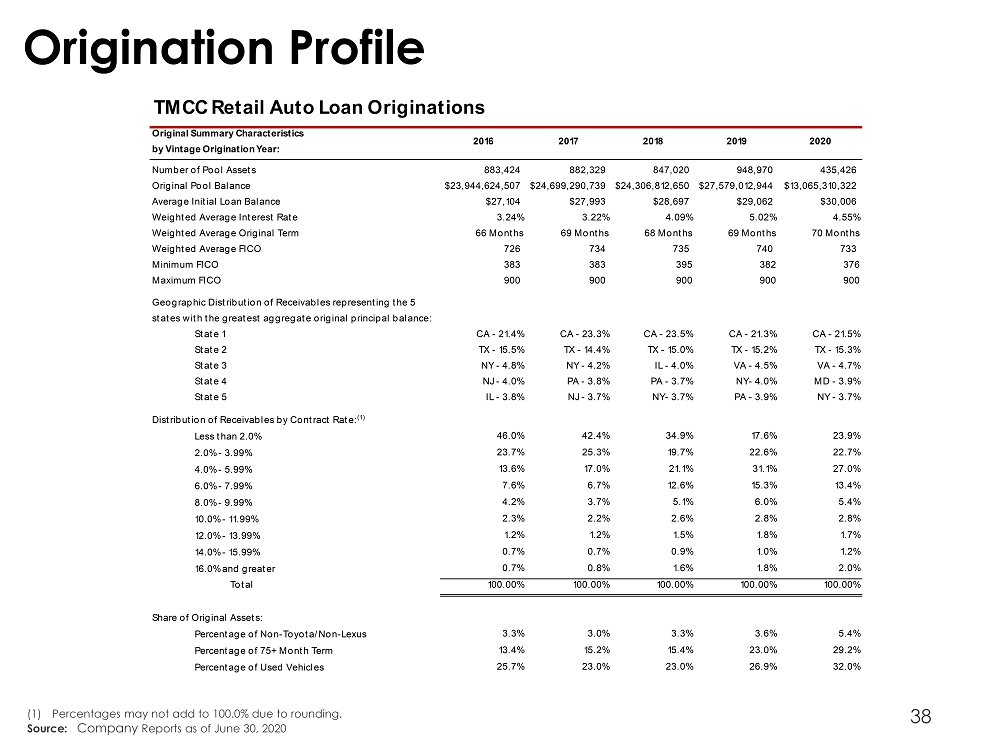
38 Origination Profile (1) Percentages may not add to 100.0% due to rounding. Source: Company Reports as of June 30, 2020 TMCC Retail Auto Loan Originations Original Summary Characteristics by Vintage Origination Year: 2016 2017 2018 2019 2020 Number of Pool Assets 883,424 882,329 847,020 948,970 435,426 Original Pool Balance $23,944,624,507 $24,699,290,739 $24,306,812,650 $27,579,012,944 $13,065,310,322 Average Initial Loan Balance $27,104 $27,993 $28,697 $29,062 $30,006 Weighted Average Interest Rate 3.24% 3.22% 4.09% 5.02% 4.55% Weighted Average Original Term 66 Months 69 Months 68 Months 69 Months 70 Months Weighted Average FICO 726 734 735 740 733 Minimum FICO 383 383 395 382 376 Maximum FICO 900 900 900 900 900 Geographic Distribution of Receivables representing the 5 states with the greatest aggregate original principal balance: State 1 CA - 21.4% CA - 23.3% CA - 23.5% CA - 21.3% CA - 21.5% State 2 TX - 15.5% TX - 14.4% TX - 15.0% TX - 15.2% TX - 15.3% State 3 NY - 4.8% NY - 4.2% IL - 4.0% VA - 4.5% VA - 4.7% State 4 NJ - 4.0% PA - 3.8% PA - 3.7% NY- 4.0% MD - 3.9% State 5 IL - 3.8% NJ - 3.7% NY- 3.7% PA - 3.9% NY - 3.7% Distribution of Receivables by Contract Rate: (1) Less than 2.0% 46.0% 42.4% 34.9% 17.6% 23.9% 2.0% - 3.99% 23.7% 25.3% 19.7% 22.6% 22.7% 4.0% - 5.99% 13.6% 17.0% 21.1% 31.1% 27.0% 6.0% - 7.99% 7.6% 6.7% 12.6% 15.3% 13.4% 8.0% - 9.99% 4.2% 3.7% 5.1% 6.0% 5.4% 10.0% - 11.99% 2.3% 2.2% 2.6% 2.8% 2.8% 12.0% - 13.99% 1.2% 1.2% 1.5% 1.8% 1.7% 14.0% - 15.99% 0.7% 0.7% 0.9% 1.0% 1.2% 16.0% and greater 0.7% 0.8% 1.6% 1.8% 2.0% Total 100.00% 100.00% 100.00% 100.00% 100.00% Share of Original Assets: Percentage of Non-Toyota/Non-Lexus 3.3% 3.0% 3.3% 3.6% 5.4% Percentage of 75+ Month Term 13.4% 15.2% 15.4% 23.0% 29.2% Percentage of Used Vehicles 25.7% 23.0% 23.0% 26.9% 32.0%
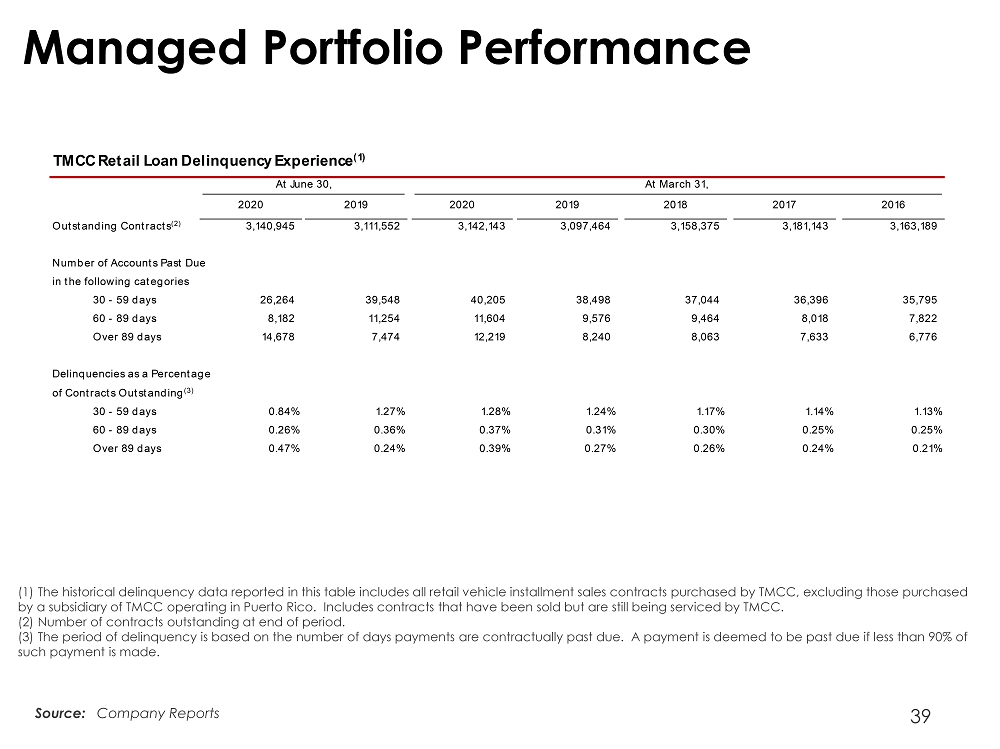
39 Managed Portfolio Performance (1) The historical delinquency data reported in this table includes all retail vehicle installment sales contracts purchased by TMCC, excluding those purchased by a subsidiary of TMCC operating in Puerto Rico. Includes contracts that have been sold but are still being serviced by TMC C. (2) Number of contracts outstanding at end of period. (3) The period of delinquency is based on the number of days payments are contractually past due. A payment is deemed to be pas t due if less than 90% of such payment is made. Source: Company Reports 2020 2019 2020 2019 2018 2017 2016 Outstanding Contracts (2) 3,140,945 3,111,552 3,142,143 3,097,464 3,158,375 3,181,143 3,163,189 Number of Accounts Past Due in the following categories 30 - 59 days 26,264 39,548 40,205 38,498 37,044 36,396 35,795 60 - 89 days 8,182 11,254 11,604 9,576 9,464 8,018 7,822 Over 89 days 14,678 7,474 12,219 8,240 8,063 7,633 6,776 Delinquencies as a Percentage of Contracts Outstanding (3) 30 - 59 days 0.84% 1.27% 1.28% 1.24% 1.17% 1.14% 1.13% 60 - 89 days 0.26% 0.36% 0.37% 0.31% 0.30% 0.25% 0.25% Over 89 days 0.47% 0.24% 0.39% 0.27% 0.26% 0.24% 0.21% TMCC Retail Loan Delinquency Experience (1) At March 31, At June 30,
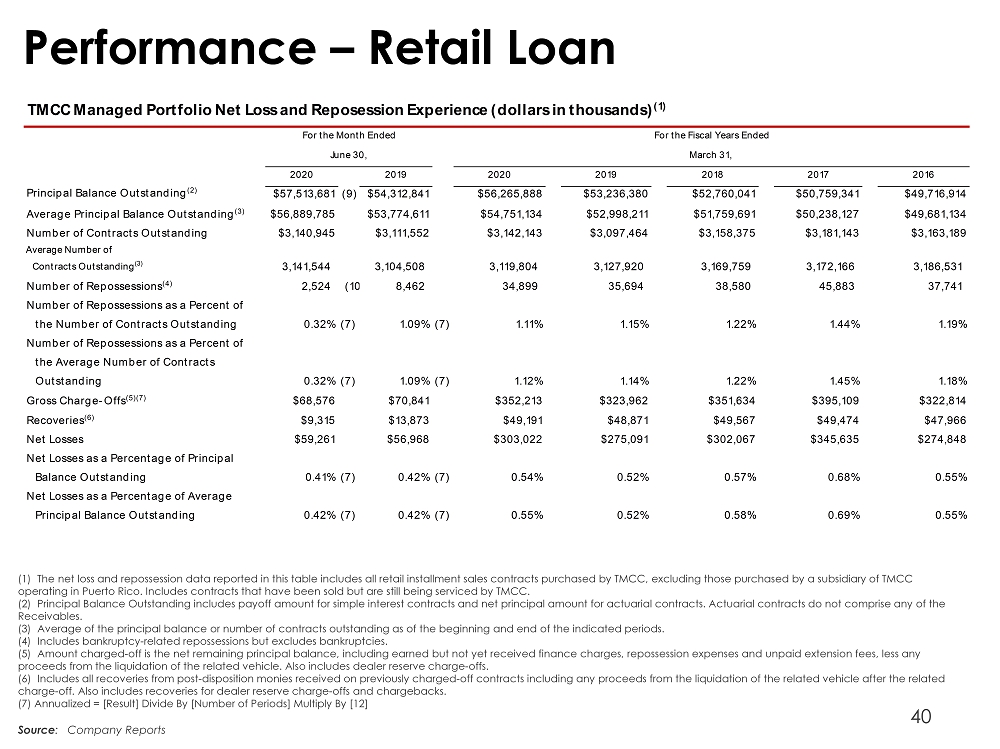
40 Performance – Retail Loan (1) The net loss and repossession data reported in this table includes all retail installment sales contracts purchased by T MCC , excluding those purchased by a subsidiary of TMCC operating in Puerto Rico. Includes contracts that have been sold but are still being serviced by TMCC. (2) Principal Balance Outstanding includes payoff amount for simple interest contracts and net principal amount for actuaria l c ontracts. Actuarial contracts do not comprise any of the Receivables. (3) Average of the principal balance or number of contracts outstanding as of the beginning and end of the indicated periods . (4) Includes bankruptcy - related repossessions but excludes bankruptcies. (5) Amount charged - off is the net remaining principal balance, including earned but not yet received finance charges, repossess ion expenses and unpaid extension fees, less any proceeds from the liquidation of the related vehicle. Also includes dealer reserve charge - offs. (6) Includes all recoveries from post - disposition monies received on previously charged - off contracts including any proceeds from the liquidation of the related vehicle after the related charge - off. Also includes recoveries for dealer reserve charge - offs and chargebacks. (7) Annualized = [Result] Divide By [Number of Periods] Multiply By [12] Source : Company Reports 2020 2019 2020 2019 2018 2017 2016 Principal Balance Outstanding (2) $57,513,681 (9) $54,312,841 $56,265,888 $53,236,380 $52,760,041 $50,759,341 $49,716,914 Average Principal Balance Outstanding (3) $56,889,785 $53,774,611 $54,751,134 $52,998,211 $51,759,691 $50,238,127 $49,681,134 Number of Contracts Outstanding $3,140,945 $3,111,552 $3,142,143 $3,097,464 $3,158,375 $3,181,143 $3,163,189 Average Number of Contracts Outstanding (3) 3,141,544 3,104,508 3,119,804 3,127,920 3,169,759 3,172,166 3,186,531 Number of Repossessions (4) 2,524 (10) 8,462 34,899 35,694 38,580 45,883 37,741 Number of Repossessions as a Percent of the Number of Contracts Outstanding 0.32% (7) 1.09%(7) 1.11% 1.15% 1.22% 1.44% 1.19% Number of Repossessions as a Percent of the Average Number of Contracts Outstanding 0.32% (7) 1.09%(7) 1.12% 1.14% 1.22% 1.45% 1.18% Gross Charge-Offs (5)(7) $68,576 $70,841 $352,213 $323,962 $351,634 $395,109 $322,814 Recoveries (6) $9,315 $13,873 $49,191 $48,871 $49,567 $49,474 $47,966 Net Losses $59,261 $56,968 $303,022 $275,091 $302,067 $345,635 $274,848 Net Losses as a Percentage of Principal Balance Outstanding 0.41%(7) 0.42% (7) 0.54% 0.52% 0.57% 0.68% 0.55% Net Losses as a Percentage of Average Principal Balance Outstanding 0.42% (7) 0.42% (7) 0.55% 0.52% 0.58% 0.69% 0.55% For the Month Ended June 30, For the Fiscal Years Ended March 31, TMCC Managed Portfolio Net Loss and Reposession Experience (dollars in thousands) (1)
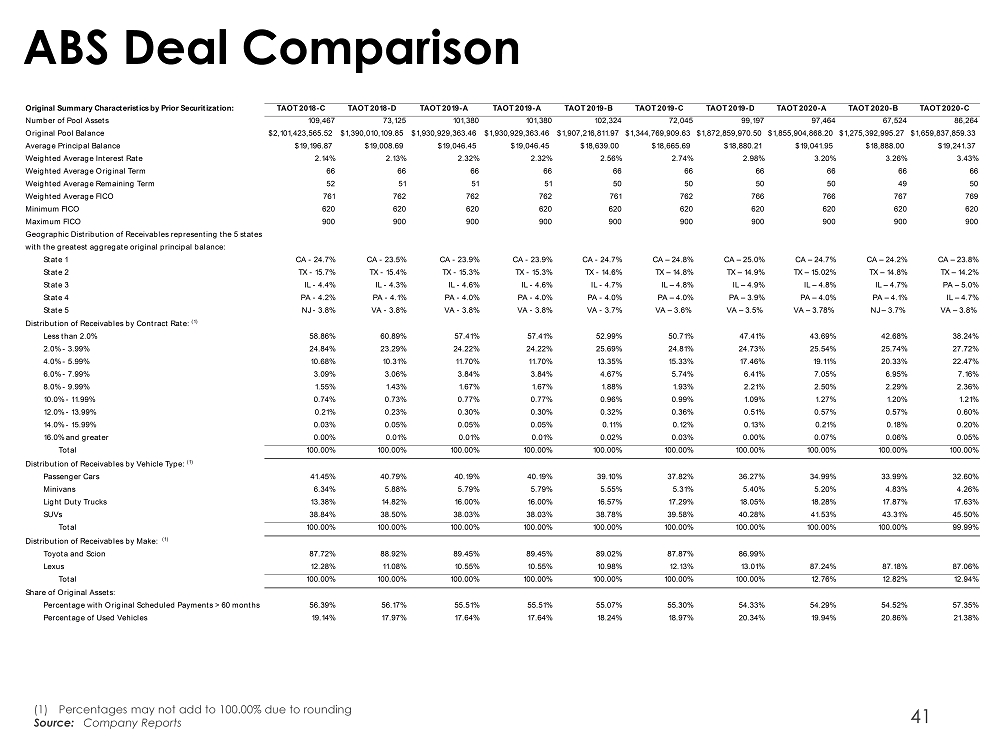
41 ABS Deal Comparison (1) Percentages may not add to 100.00% due to rounding Source: Company Reports Original Summary Characteristics by Prior Securitization: TAOT 2018-C TAOT 2018-D TAOT 2019-A TAOT 2019-A TAOT 2019-B TAOT 2019-C TAOT 2019-D TAOT 2020-A TAOT 2020-B TAOT 2020-C Number of Pool Assets 109,467 73,125 101,380 101,380 102,324 72,045 99,197 97,464 67,524 86,264 Original Pool Balance $2,101,423,565.52 $1,390,010,109.85 $1,930,929,363.46 $1,930,929,363.46 $1,907,216,811.97 $1,344,769,909.63 $1,872,859,970.50 $1,855,904,868.20 $1,275,392,995.27 $1,659,837,859.33 Average Principal Balance $19,196.87 $19,008.69 $19,046.45 $19,046.45 $18,639.00 $18,665.69 $18,880.21 $19,041.95 $18,888.00 $19,241.37 Weighted Average Interest Rate 2.14% 2.13% 2.32% 2.32% 2.56% 2.74% 2.98% 3.20% 3.26% 3.43% Weighted Average Original Term 66 66 66 66 66 66 66 66 66 66 Weighted Average Remaining Term 52 51 51 51 50 50 50 50 49 50 Weighted Average FICO 761 762 762 762 761 762 766 766 767 769 Minimum FICO 620 620 620 620 620 620 620 620 620 620 Maximum FICO 900 900 900 900 900 900 900 900 900 900 Geographic Distribution of Receivables representing the 5 states with the greatest aggregate original principal balance: State 1 CA - 24.7% CA - 23.5% CA - 23.9% CA - 23.9% CA - 24.7% CA – 24.8% CA – 25.0% CA – 24.7% CA – 24.2% CA – 23.8% State 2 TX - 15.7% TX - 15.4% TX - 15.3% TX - 15.3% TX - 14.6% TX – 14.8% TX – 14.9% TX – 15.02% TX – 14.8% TX – 14.2% State 3 IL - 4.4% IL - 4.3% IL - 4.6% IL - 4.6% IL - 4.7% IL – 4.8% IL – 4.9% IL – 4.8% IL – 4.7% PA – 5.0% State 4 PA - 4.2% PA - 4.1% PA - 4.0% PA - 4.0% PA - 4.0% PA – 4.0% PA – 3.9% PA – 4.0% PA – 4.1% IL – 4.7% State 5 NJ - 3.8% VA - 3.8% VA - 3.8% VA - 3.8% VA - 3.7% VA – 3.6% VA – 3.5% VA – 3.78% NJ – 3.7% VA – 3.8% Distribution of Receivables by Contract Rate: (1) Less than 2.0% 58.86% 60.89% 57.41% 57.41% 52.99% 50.71% 47.41% 43.69% 42.68% 38.24% 2.0% - 3.99% 24.84% 23.29% 24.22% 24.22% 25.69% 24.81% 24.73% 25.54% 25.74% 27.72% 4.0% - 5.99% 10.68% 10.31% 11.70% 11.70% 13.35% 15.33% 17.46% 19.11% 20.33% 22.47% 6.0% - 7.99% 3.09% 3.06% 3.84% 3.84% 4.67% 5.74% 6.41% 7.05% 6.95% 7.16% 8.0% - 9.99% 1.55% 1.43% 1.67% 1.67% 1.88% 1.93% 2.21% 2.50% 2.29% 2.36% 10.0% - 11.99% 0.74% 0.73% 0.77% 0.77% 0.96% 0.99% 1.09% 1.27% 1.20% 1.21% 12.0% - 13.99% 0.21% 0.23% 0.30% 0.30% 0.32% 0.36% 0.51% 0.57% 0.57% 0.60% 14.0% - 15.99% 0.03% 0.05% 0.05% 0.05% 0.11% 0.12% 0.13% 0.21% 0.18% 0.20% 16.0% and greater 0.00% 0.01% 0.01% 0.01% 0.02% 0.03% 0.00% 0.07% 0.06% 0.05% Total 100.00% 100.00% 100.00% 100.00% 100.00% 100.00% 100.00% 100.00% 100.00% 100.00% Distribution of Receivables by Vehicle Type: (1) Passenger Cars 41.45% 40.79% 40.19% 40.19% 39.10% 37.82% 36.27% 34.99% 33.99% 32.60% Minivans 6.34% 5.88% 5.79% 5.79% 5.55% 5.31% 5.40% 5.20% 4.83% 4.26% Light Duty Trucks 13.38% 14.82% 16.00% 16.00% 16.57% 17.29% 18.05% 18.28% 17.87% 17.63% SUVs 38.84% 38.50% 38.03% 38.03% 38.78% 39.58% 40.28% 41.53% 43.31% 45.50% Total 100.00% 100.00% 100.00% 100.00% 100.00% 100.00% 100.00% 100.00% 100.00% 99.99% Distribution of Receivables by Make: (1) Toyota and Scion 87.72% 88.92% 89.45% 89.45% 89.02% 87.87% 86.99% Lexus 12.28% 11.08% 10.55% 10.55% 10.98% 12.13% 13.01% 87.24% 87.18% 87.06% Total 100.00% 100.00% 100.00% 100.00% 100.00% 100.00% 100.00% 12.76% 12.82% 12.94% Share of Original Assets: Percentage with Original Scheduled Payments > 60 months 56.39% 56.17% 55.51% 55.51% 55.07% 55.30% 54.33% 54.29% 54.52% 57.35% Percentage of Used Vehicles 19.14% 17.97% 17.64% 17.64% 18.24% 18.97% 20.34% 19.94% 20.86% 21.38%
42