Exhibit 99.2
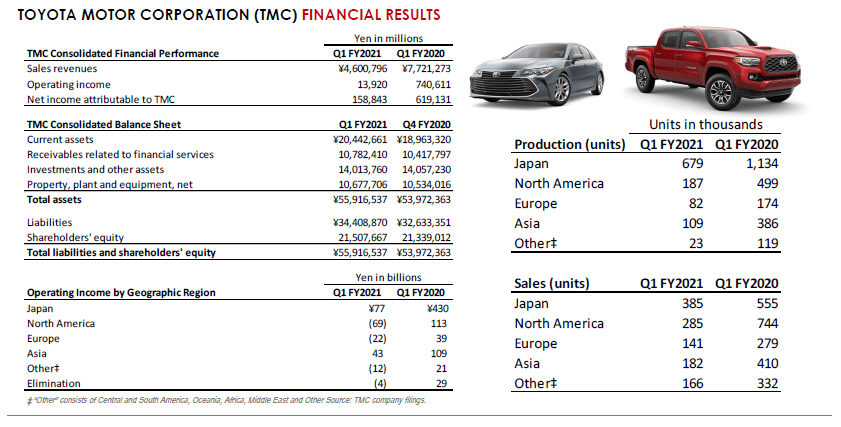
Toyota Business Highlights Q1FY2021 TOYOTA MOTOR NORTH MERICA, INC. (Toyota U.S.) MONTHLY RESULTS • The U . S . automobile SAAR figure for June 2020 came in at 13 . 1 M units, down from June 2019 at 17 . 3 M units . • Toyota U . S . reported June 2020 sales of 148 , 280 units, a decrease of 23 . 8 % on a daily selling rate (DSR) basis and a decrease of 26 . 7 % on a volume basis versus June 2019 . • Lexus division posted June 2020 sales of 20 , 690 units, a decrease of 6 . 6 % on a DSR basis and a decrease of 10 . 2 % on a volume basis versus June 2019 . • North American production as a percentage of U . S . sales for June 2020 was 60 . 2 % , down from 66 . 0 % in June 2019 . Source: Toyota, Bloomberg, Ward’s Automotive Group Toyota U.S. monthly results include fleet sales volume TOYOTA MOTOR CORPORATION (TMC) FINANCIAL RESULTS ‡ “Other” consists of Central and South America, Oceania, Africa, Middle East and Other Source: TMC company filings. Production (units) Q1 FY2021 Q1 FY2020 Japan 679 1,134 North America 187 499 Europe 82 174 Asia 109 386 Other‡ 23 119 Sales (units) Q1 FY2021 Q1 FY2020 Japan 385 555 North America 285 744 Europe 141 279 Asia 182 410 Other‡ 166 332 Units in thousands TMC Consolidated Financial Performance Q1 FY2021 Q1 FY2020 Sales revenues ¥4,600,796 ¥7,721,273 Operating income 13,920 740,611 Net income attributable to TMC 158,843 619,131 TMC Consolidated Balance Sheet Q1 FY2021 Q4 FY2020 Current assets ¥20,442,661 ¥18,963,320 Receivables related to financial services 10,782,410 10,417,797 Investments and other assets 14,013,760 14,057,230 Property, plant and equipment, net 10,677,706 10,534,016 Total assets ¥55,916,537 ¥53,972,363 Liabilities ¥34,408,870 ¥32,633,351 Shareholders' equity 21,507,667 21,339,012 Total liabilities and shareholders' equity ¥55,916,537 ¥53,972,363 Yen in billions Operating Income by Geographic Region Q1 FY2021 Q1 FY2020 Japan ¥77 ¥430 North America (69) 113 Europe (22) 39 Asia 43 109 Other‡ (12) 21 Elimination (4) 29 Yen in millions *Bar chart represents vehicles sales as % of Top 5 Models sales 0 50 100 150 200 250 300 6 11 16 21 Jun-15 Sep-15 Dec-15 Mar-16 Jun-16 Sep-16 Dec-16 Mar-17 Jun-17 Sep-17 Dec-17 Mar-18 Jun-18 Sep-18 Dec-18 Mar-19 Jun-19 Sep-19 Dec-19 Mar-20 Jun-20 Toyota U.S. Light Vehicle Sales (units in thousands) Seasonally Adjusted Annual Rate (units in millions) U.S. Light Vehicle Seasonally Adjusted Annual Rate (SAAR) and Toyota U.S. Sales June 2015 - June 2020 SAAR Toyota U.S. Sales 127,590 20,690 Toyota Division Lexus Division Toyota U.S. June 2020 Vehicle Sales Jun-20 Jun-19 Jun-20 Jun-19 RAV4 34,093 39,152 CAMRY 16,509 28,889 COROLLA 15,079 28,869 HIGHLANDER 14,084 19,824 TACOMA 12,023 20,476 Toyota U.S. June Vehicles Sales Toyota Division Top 5 Models Jun-20 Jun-19 Jun-20 Jun-19 RX 6,341 8,228 NX 4,642 4,248 ES 3,415 4,350 GX 2,495 1,947 UX 1,634 1,351 Toyota U.S. June Vehicles Sales Lexus Division Top 5 Models Exhibit 99.2
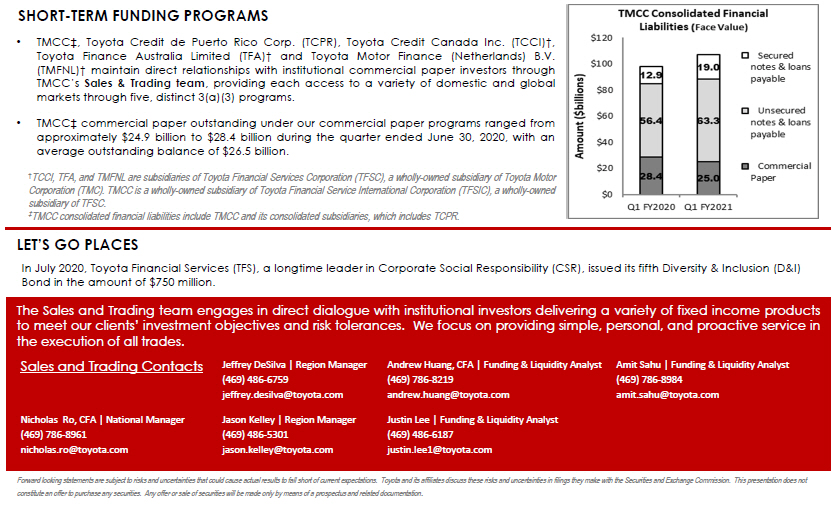
TOYOTA MOTOR CREDIT CORPORATION (TMCC) FINANCIAL RESULTS • Our consolidated net income was $374 million for the first quarter of fiscal 2021 compared to $359 million for the same period in fiscal 2020. The increase in net income for the first quarter of fiscal 2021, compared to the same period in fiscal 2020, was primarily due to a $149 million decrease in interest expense, a $58 million increase in investment and other income, net, and a $38 million decrease in insurance losses and loss adjustment expenses, partially offset by a $108 million increase in provision for credit losses, a $60 million increase in depreciation on operating leases, and a $51 million decrease in total financing revenues. • We recorded a provision for credit losses of $183 million for the first quarter of fiscal 2021, compared to $75 million for the same period in fiscal 2020. The increase in the provision for credit losses for the first quarter of fiscal 2021, compared to the same period in fiscal 2020, was due to the increase in expected credit losses driven by a decline in economic conditions caused by the COVID - 19 pandemic and the restrictions designed to slow the spread of COVID - 19, which resulted in stay - at - home orders, increased unemployment, and decreased consumer spending and our adoption of ASU 2016 - 13 in fiscal 2021, which replaced the incurred loss impairment model with one that reflects expected credit losses over the expected life of the finance receivables. • Net charge - offs as a percentage of average gross finance receivables remained relatively unchanged at 0.32 percent at both June 30, 2020 and June 30, 2019. Default frequency as a percentage of outstanding finance receivable contracts decreased to 0.82 percent for the first quarter of fiscal 2021, compared to 1.21 percent in the same period in fiscal 2020, primarily due to the payment extension programs offered to our customers impacted by COVID - 19. 1 TMCC market share represents the percentage of total domestic TMNA sales of new Toyota and Lexus vehicles financed by us, exc lud ing sales under dealer rental car and commercial fleet programs, sales of a private Toyota distributors and Mazda vehicles financed. * TMCC consumer portfolio includes TMCC and its consolidated subsidiaries. SHORT - TERM FUNDING PROGRAMS • TMCC ‡ , Toyota Credit de Puerto Rico Corp . (TCPR), Toyota Credit Canada Inc . (TCCI)†, Toyota Finance Australia Limited (TFA)† and Toyota Motor Finance (Netherlands) B . V . (TMFNL)† maintain direct relationships with institutional commercial paper investors through TMCC’s Sales & Trading team , providing each access to a variety of domestic and global markets through five, distinct 3 (a)( 3 ) programs . • TMCC ‡ c ommercial paper outstanding under our commercial paper programs ranged from approximately $ 24 . 9 billion to $ 28 . 4 billion during the quarter ended June 30 , 2020 , with an average outstanding balance of $ 26 . 5 billion . † TCCI, TFA, and TMFNL are subsidiaries of Toyota Financial Services Corporation (TFSC), a wholly - owned subsidiary of Toyota Motor Corporation (TMC). TMCC is a wholly - owned subsidiary of Toyota Financial Service International Corporation (TFSIC), a wholly - own ed subsidiary of TFSC. ‡ TMCC consolidated financial liabilities include TMCC and its consolidated subsidiaries, which includes TCPR. LET’S GO PLACES In July 2020, Toyota Financial Services (TFS), a longtime leader in Corporate Social Responsibility (CSR), issued its fifth D ive rsity & Inclusion (D&I) Bond in the amount of $750 million. The Sales and Trading team engages in direct dialogue with institutional investors delivering a variety of fixed income products to meet our clients’ investment objectives and risk tolerances . We focus on providing simple, personal, and proactive service in the execution of all trades . Sales and Trading Contacts Jeffrey DeSilva | Region Manager (469) 486 - 6759 jeffrey.desilva@toyota.com Andrew Huang, CFA | Funding & Liquidity Analyst (469) 786 - 8219 andrew.huang@toyota.com Amit Sahu | Funding & Liquidity Analyst (469) 786 - 8984 amit.sahu@toyota.com Nicholas Ro, CFA | National Manager (469) 786 - 8961 nicholas.ro@toyota.com Jason Kelley | Region Manager (469) 486 - 5301 jason.kelley@toyota.com Justin Lee | Funding & Liquidity Analyst (469) 486 - 6187 justin.lee1@toyota.com Forward looking statements are subject to risks and uncertainties that could cause actual results to fall short of current ex pec tations. Toyota and its affiliates discuss these risks and uncertainties in filings they make with the Securities and Exchan ge Commission. This presentation does not constitute an offer to purchase any securities. Any offer or sale of securities will be made only by means of a prospectus a nd related documentation . TMCC Financial Performance Q1 FY2020 Q1 FY2021 Total financing revenues $2,963 $2,912 Income before income taxes 463 487 Net Income 359 374 Debt-to-Equity Ratio 7.0x 7.3x U.S. dollars in millions