Exhibit 99.2
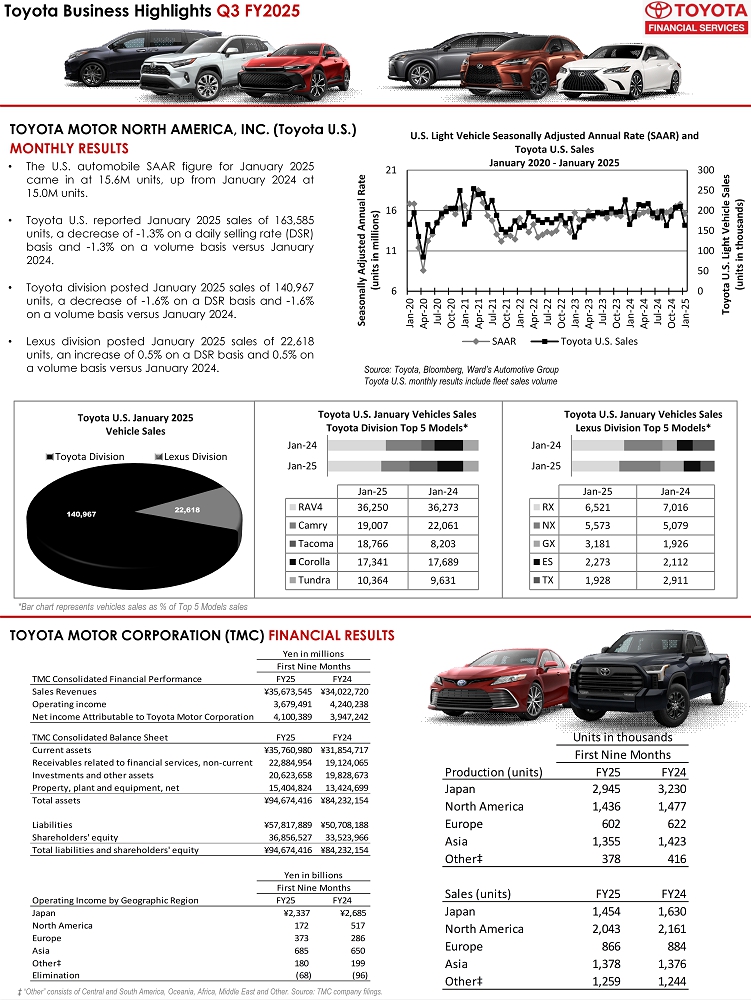
Toyota Business Highlights Q3 FY2025 TOYOTA MOTOR NORTH AMERICA, INC. (Toyota U.S.) MONTHLY RESULTS • The U . S . automobile SAAR figure for January 2025 came in at 15 . 6 M units, up from January 2024 at 15 . 0 M units . • Toyota U . S . reported January 2025 sales of 163 , 585 units, a decrease of - 1 . 3 % on a daily selling rate (DSR) basis and - 1 . 3 % on a volume basis versus January 2024 . • Toyota division posted January 2025 sales of 140 , 967 units, a decrease of - 1 . 6 % on a DSR basis and - 1 . 6 % on a volume basis versus January 2024 . • Lexus division posted January 2025 sales of 22 , 618 units, an increase of 0 . 5 % on a DSR basis and 0 . 5 % on a volume basis versus January 2024 . Source: Toyota, Bloomberg, Ward’s Automotive Group Toyota U.S. monthly results include fleet sales volume TOYOTA MOTOR CORPORATION (TMC) FINANCIAL RESULTS ‡ “Other” consists of Central and South America, Oceania, Africa, Middle East and Other. Source: TMC company filings. *Bar chart represents vehicles sales as % of Top 5 Models sales 140,967 22,618 Toyota Division Lexus Division Toyota U.S. January 2025 Vehicle Sales Production (units) FY25 FY24 Japan 2,945 3,230 North America 1,436 1,477 Europe 602 622 Asia 1,355 1,423 Other‡ 378 416 Sales (units) FY25 FY24 Japan 1,454 1,630 North America 2,043 2,161 Europe 866 884 Asia 1,378 1,376 Other‡ 1,259 1,244 First Nine Months Units in thousands Jan-25 Jan-24 Jan-25 Jan-24 RAV4 36,250 36,273 Camry 19,007 22,061 Tacoma 18,766 8,203 Corolla 17,341 17,689 Tundra 10,364 9,631 Toyota U.S. January Vehicles Sales Toyota Division Top 5 Models* 0 50 100 150 200 250 300 6 11 16 21 Jan-20 Apr-20 Jul-20 Oct-20 Jan-21 Apr-21 Jul-21 Oct-21 Jan-22 Apr-22 Jul-22 Oct-22 Jan-23 Apr-23 Jul-23 Oct-23 Jan-24 Apr-24 Jul-24 Oct-24 Jan-25 Toyota U.S. Light Vehicle Sales (units in thousands) Seasonally Adjusted Annual Rate (units in millions) U.S. Light Vehicle Seasonally Adjusted Annual Rate (SAAR) and Toyota U.S. Sales January 2020 - January 2025 SAAR Toyota U.S. Sales Jan-25 Jan-24 Jan-25 Jan-24 RX 6,521 7,016 NX 5,573 5,079 GX 3,181 1,926 ES 2,273 2,112 TX 1,928 2,911 Toyota U.S. January Vehicles Sales Lexus Division Top 5 Models* TMC Consolidated Financial Performance FY25 FY24 Sales Revenues ¥35,673,545 ¥34,022,720 Operating income 3,679,491 4,240,238 Net income Attributable to Toyota Motor Corporation 4,100,389 3,947,242 TMC Consolidated Balance Sheet FY25 FY24 Current assets ¥35,760,980 ¥31,854,717 Receivables related to financial services, non-current 22,884,954 19,124,065 Investments and other assets 20,623,658 19,828,673 Property, plant and equipment, net 15,404,824 13,424,699 Total assets ¥94,674,416 ¥84,232,154 Liabilities ¥57,817,889 ¥50,708,188 Shareholders' equity 36,856,527 33,523,966 Total liabilities and shareholders' equity ¥94,674,416 ¥84,232,154 Yen in billions Operating Income by Geographic Region FY25 FY24 Japan ¥2,337 ¥2,685 North America 172 517 Europe 373 286 Asia 685 650 Other‡ 180 199 Elimination (68) (96) First Nine Months Yen in millions First Nine Months
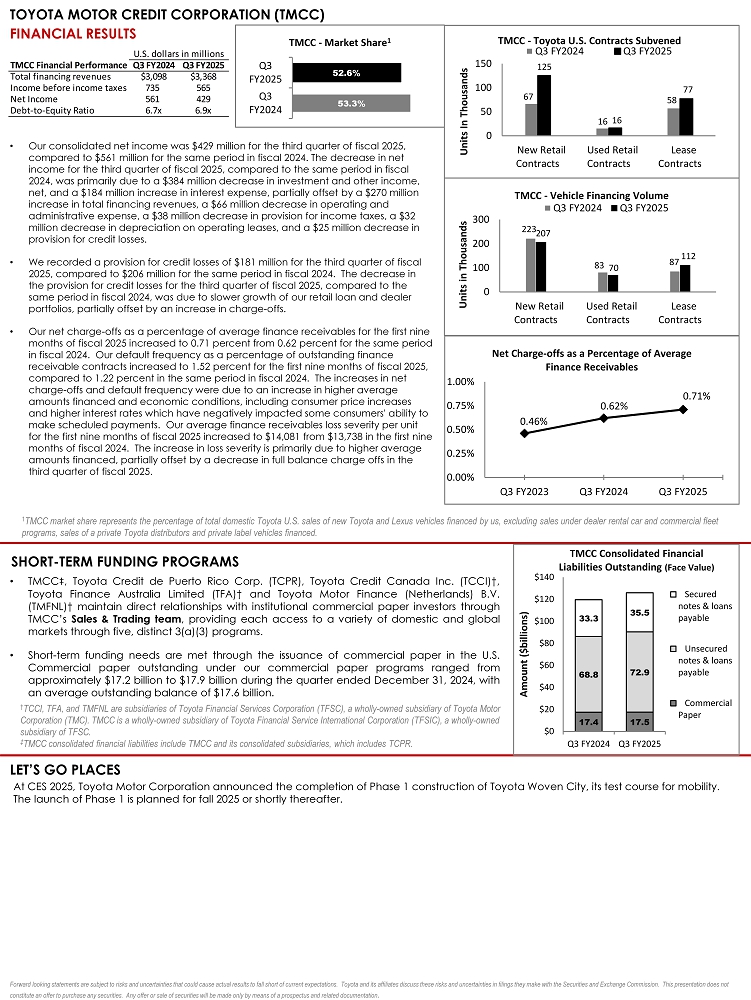
TOYOTA MOTOR CREDIT CORPORATION (TMCC) FINANCIAL RESULTS • Our consolidated net income was $429 million for the third quarter of fiscal 2025, compared to $561 million for the same period in fiscal 2024. The decrease in net income for the third quarter of fiscal 2025, compared to the same period in fiscal 2024, was primarily due to a $384 million decrease in investment and other income, net, and a $184 million increase in interest expense, partially offset by a $270 million increase in total financing revenues, a $66 million decrease in operating and administrative expense, a $38 million decrease in provision for income taxes, a $32 million decrease in depreciation on operating leases, and a $25 million decrease in provision for credit losses. • We recorded a provision for credit losses of $181 million for the third quarter of fiscal 2025, compared to $206 million for the same period in fiscal 2024. The decrease in the provision for credit losses for the third quarter of fiscal 2025, compared to the same period in fiscal 2024, was due to slower growth of our retail loan and dealer portfolios, partially offset by an increase in charge - offs. • Our net charge - offs as a percentage of average finance receivables for the first nine months of fiscal 2025 increased to 0.71 percent from 0.62 percent for the same period in fiscal 2024. Our default frequency as a percentage of outstanding finance receivable contracts increased to 1.52 percent for the first nine months of fiscal 2025, compared to 1.22 percent in the same period in fiscal 2024. The increases in net charge - offs and default frequency were due to an increase in higher average amounts financed and economic conditions, including consumer price increases and higher interest rates which have negatively impacted some consumers' ability to make scheduled payments. Our average finance receivables loss severity per unit for the first nine months of fiscal 2025 increased to $14,081 from $13,738 in the first nine months of fiscal 2024. The increase in loss severity is primarily due to higher average amounts financed, partially offset by a decrease in full balance charge offs in the third quarter of fiscal 2025. 1 TMCC market share represents the percentage of total domestic Toyota U.S. sales of new Toyota and Lexus vehicles financed by us, excluding sales under dealer rental car and commercial fleet programs, sales of a private Toyota distributors and private label vehicles financed. SHORT - TERM FUNDING PROGRAMS • TMCC ‡ , Toyota Credit de Puerto Rico Corp . (TCPR), Toyota Credit Canada Inc . (TCCI)†, Toyota Finance Australia Limited (TFA)† and Toyota Motor Finance (Netherlands) B . V . (TMFNL)† maintain direct relationships with institutional commercial paper investors through TMCC’s Sales & Trading team , providing each access to a variety of domestic and global markets through five, distinct 3 (a)( 3 ) programs . • Short - term funding needs are met through the issuance of commercial paper in the U . S . Commercial paper outstanding under our commercial paper programs ranged from approximately $ 17 . 2 billion to $ 17 . 9 billion during the quarter ended December 31 , 2024 , with an average outstanding balance of $ 17 . 6 billion . † TCCI, TFA, and TMFNL are subsidiaries of Toyota Financial Services Corporation (TFSC), a wholly - owned subsidiary of Toyota Motor Corporation (TMC). TMCC is a wholly - owned subsidiary of Toyota Financial Service International Corporation (TFSIC), a wholly - own ed subsidiary of TFSC. ‡ TMCC consolidated financial liabilities include TMCC and its consolidated subsidiaries, which includes TCPR. LET’S GO PLACES At CES 2025, Toyota Motor Corporation announced the completion of Phase 1 construction of Toyota Woven City, its test course for mobility. The launch of Phase 1 is planned for fall 2025 or shortly thereafter. Forward looking statements are subject to risks and uncertainties that could cause actual results to fall short of current ex pec tations. Toyota and its affiliates discuss these risks and uncertainties in filings they make with the Securities and Exchan ge Commission. This presentation does not constitute an offer to purchase any securities. Any offer or sale of securities will be made only by means of a prospectus a nd related documentation . TMCC Financial PerformanceQ3 FY2024 Q3 FY2025 Total financing revenues $3,098 $3,368 Income before income taxes 735 565 Net Income 561 429 Debt-to-Equity Ratio 6.7x 6.9x U.S. dollars in millions 53.3% 52.6% Q3 FY2024 Q3 FY2025 TMCC - Market Share 1 67 16 58 125 16 77 0 50 100 150 New Retail Contracts Used Retail Contracts Lease Contracts Units In Thousands TMCC - Toyota U.S. Contracts Subvened Q3 FY2024 Q3 FY2025 223 83 87 207 70 112 0 100 200 300 New Retail Contracts Used Retail Contracts Lease Contracts Units in Thousands TMCC - Vehicle Financing Volume Q3 FY2024 Q3 FY2025 0.46% 0.62% 0.71% 0.00% 0.25% 0.50% 0.75% 1.00% Q3 FY2023 Q3 FY2024 Q3 FY2025 Net Charge - offs as a Percentage of Average Finance Receivables 17.4 17.5 68.8 72.9 33.3 35.5 $0 $20 $40 $60 $80 $100 $120 $140 Q3 FY2024 Q3 FY2025 Amount ($billions) TMCC Consolidated Financial Liabilities Outstanding (Face Value) Secured notes & loans payable Unsecured notes & loans payable Commercial Paper